
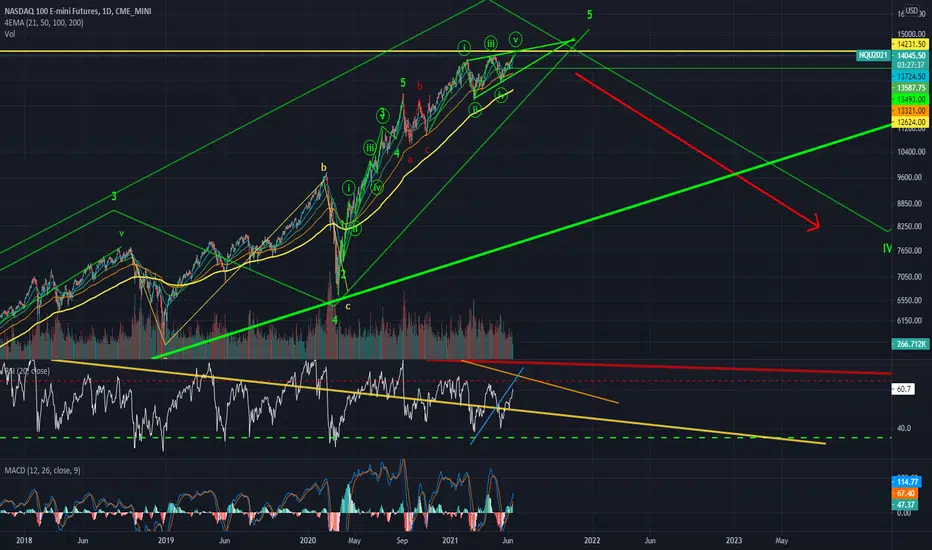
Tracking this formation as an ending diagonal.
This might be THE ending diagonal.
The ending point can be a higher high or lower one.
Many times you'll see a bump up above the top of the diagonal before it crashes back through.
*Note: This is the exact same formation Bitcoin had a few months ago before it crashed 50%. The relation is palpable.
I see Bitcoin as the honest player in the game as far as price action and patterns go. Look at the two charts.
Diagonal remains valid unless be break above 15,000.
This might be THE ending diagonal.
The ending point can be a higher high or lower one.
Many times you'll see a bump up above the top of the diagonal before it crashes back through.
*Note: This is the exact same formation Bitcoin had a few months ago before it crashed 50%. The relation is palpable.
I see Bitcoin as the honest player in the game as far as price action and patterns go. Look at the two charts.
Diagonal remains valid unless be break above 15,000.
ノート

免責事項
これらの情報および投稿は、TradingViewが提供または承認する金融、投資、取引、またはその他の種類の助言もしくは推奨であることを意図したものではなく、またこれらに該当するものでもありません。詳細は利用規約をご覧ください。
免責事項
これらの情報および投稿は、TradingViewが提供または承認する金融、投資、取引、またはその他の種類の助言もしくは推奨であることを意図したものではなく、またこれらに該当するものでもありません。詳細は利用規約をご覧ください。