
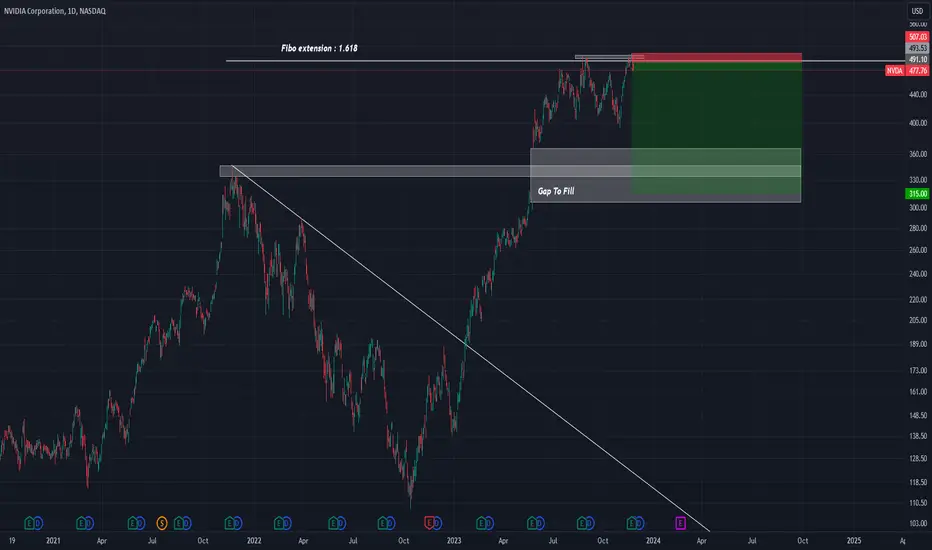
After a very big bull phase on the NVDA Stock, we start to see some reversal pattern on the 1.618 fibonacci level of extension. We can see the formation of lower lows and a stop hunting at the top (and near the extension level we are looking at).
What are we looking from ?
First we want to see the recent gap to be filled on this swing position (around the $315.0 level and the $306.0 50% of Fibonacci will be great but we can also see the $280.0 level of interest).
Then potentially, we can wait to see a bounce on this level for a long (but we are not here for now).
For me it's a strong short bias on this asset with decent R:R.
Great Trade !
What are we looking from ?
First we want to see the recent gap to be filled on this swing position (around the $315.0 level and the $306.0 50% of Fibonacci will be great but we can also see the $280.0 level of interest).
Then potentially, we can wait to see a bounce on this level for a long (but we are not here for now).
For me it's a strong short bias on this asset with decent R:R.
Great Trade !
ノート
Level of support to watch : $468.0We want this level to break for a great continuation on the down side
This level can also be the level where we put the stop to BE and/or take a little profit
ノート
Short seller are very strong on this assetLove to see the $475.0 level get rejected, so now we wait for the price to make new lows

免責事項
これらの情報および投稿は、TradingViewが提供または承認する金融、投資、取引、またはその他の種類の助言もしくは推奨であることを意図したものではなく、またこれらに該当するものでもありません。詳細は利用規約をご覧ください。
免責事項
これらの情報および投稿は、TradingViewが提供または承認する金融、投資、取引、またはその他の種類の助言もしくは推奨であることを意図したものではなく、またこれらに該当するものでもありません。詳細は利用規約をご覧ください。