
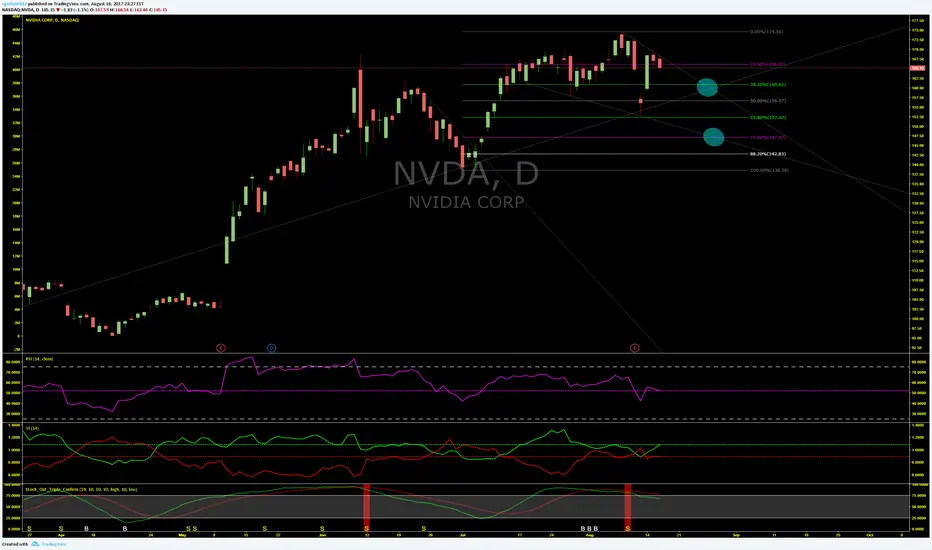
NVDA has been trending down since before their earnings call. Even though the drop might not be significant, I am using trend lines and Fibonacci levels to determine a minimal drop. The most likely drop that conforms with the trends and Fib retracement levels is at least to 160.82. If it goes beneath this level and below the trendline, A more significant drop would be in the making. It is possible the stock could drop further to 147.07. Anything beyond this should be (but probably won't) a major red flag for traders.

All forecasts are based on analysis of past behavior. Prior movements are not always indicative of future movement. Develop the theory, test the theory. Do your own research. Nothing in this analysis constitutes advice. YouTube For More. Good luck!!
免責事項
これらの情報および投稿は、TradingViewが提供または承認する金融、投資、取引、またはその他の種類の助言もしくは推奨であることを意図したものではなく、またこれらに該当するものでもありません。詳細は利用規約をご覧ください。