

Back in November, I shared with you the bearish outlook on NVDA
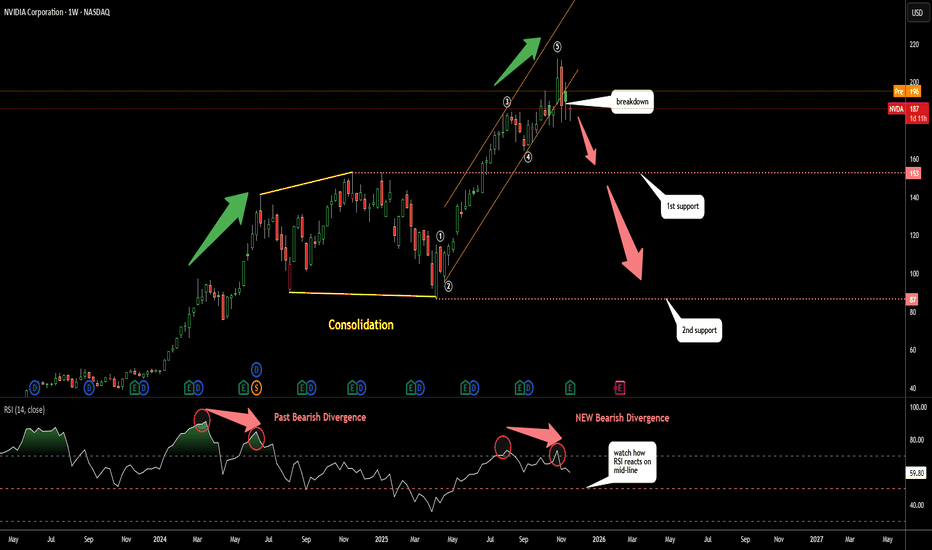
Recently we've got an early harbinger as I spotted a well-known reversal pattern that regularly appears after impulse reaches its climax and starts to reverse
Head & Shoulders reversal pattern (orange lines) is in the making on the weekly chart
We have 3 peaks with the highest in between forming the Head
The right shoulder was not built yet as the price should drop back to the Neckline
The bearish trigger set at the breakdown of the Neckline around $173
The target for H&S pattern is located at $129
It is calculated as the height of the Head subtracted from the Neckline breakdown point
Recently we've got an early harbinger as I spotted a well-known reversal pattern that regularly appears after impulse reaches its climax and starts to reverse
Head & Shoulders reversal pattern (orange lines) is in the making on the weekly chart
We have 3 peaks with the highest in between forming the Head
The right shoulder was not built yet as the price should drop back to the Neckline
The bearish trigger set at the breakdown of the Neckline around $173
The target for H&S pattern is located at $129
It is calculated as the height of the Head subtracted from the Neckline breakdown point

関連の投稿
免責事項
これらの情報および投稿は、TradingViewが提供または承認する金融、投資、取引、またはその他の種類の助言もしくは推奨であることを意図したものではなく、またこれらに該当するものでもありません。詳細は利用規約をご覧ください。
免責事項
これらの情報および投稿は、TradingViewが提供または承認する金融、投資、取引、またはその他の種類の助言もしくは推奨であることを意図したものではなく、またこれらに該当するものでもありません。詳細は利用規約をご覧ください。