 NVDA
NVDA Key Observations:
Current Price Action:
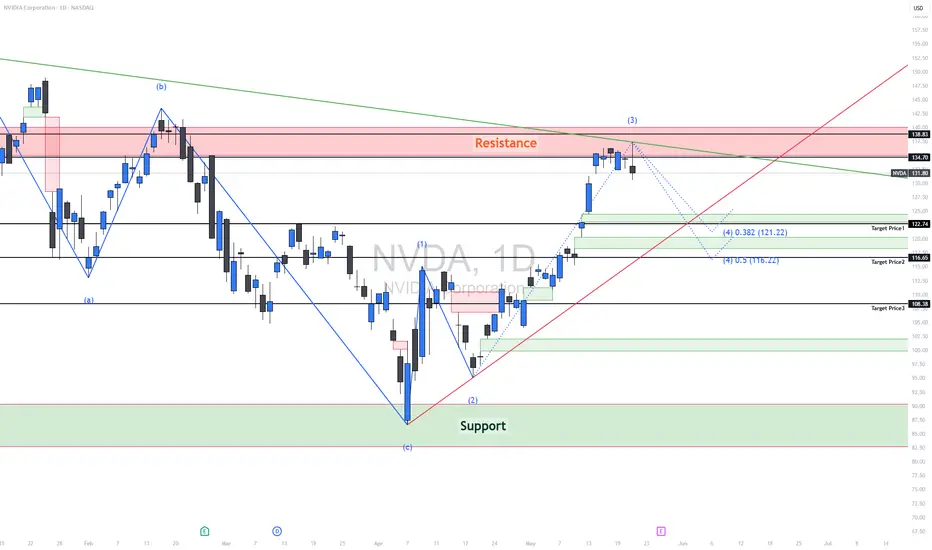
Price: $131.80
Recent Drop: -2.58 (-1.92%)
Support and Resistance Levels:
Immediate Resistance: $134.70 to $138.83
This red zone represents a strong supply area where the price has historically faced selling pressure.
Immediate Support: $122.74 (Target Price 1)
Further Supports:
Target Price 2: $116.65 (Aligned with 0.5 Fibonacci Retracement)
Target Price 3: $108.38 (Previous structural low)
Trendlines:
Red Uptrend Line: Recently broken, indicating weakening bullish momentum.
Green Downtrend Line: Long-term resistance trendline from the previous Lower Highs (LH) is still intact and respected.
The break below the minor trendline suggests a corrective wave (4) might be in motion.
Fibonacci Levels:
0.382 Fib Retracement: $121.22
0.5 Fib Retracement: $116.22
These levels align with potential targets in a wave (4) corrective phase according to Elliott Wave theory.
Target Prices:
Target Price 1: $122.74
This is the closest demand zone and aligns with the 0.382 retracement—high-probability support.
Target Price 2: $116.65
Aligned with the 0.5 Fibonacci level and previous consolidation.
Target Price 3: $108.38
A major structural support and potential wave (4) bottom if market turns sharply bearish.
Summary:
NVIDIA Corporation (NVDA) is showing early signs of a corrective phase after failing to break through strong resistance in the $134–$138 range. The price rejected the resistance zone and is likely entering wave (4) correction. Key support levels to monitor are $122.74, $116.65, and $108.38, corresponding with Fibonacci retracement levels and historical price structure. A break below the short-term trendline increases the probability of a continued pullback before potentially resuming the uptrend in wave (5).

関連の投稿
免責事項
これらの情報および投稿は、TradingViewが提供または承認する金融、投資、取引、またはその他の種類の助言もしくは推奨であることを意図したものではなく、またこれらに該当するものでもありません。詳細は利用規約をご覧ください。
免責事項
これらの情報および投稿は、TradingViewが提供または承認する金融、投資、取引、またはその他の種類の助言もしくは推奨であることを意図したものではなく、またこれらに該当するものでもありません。詳細は利用規約をご覧ください。