
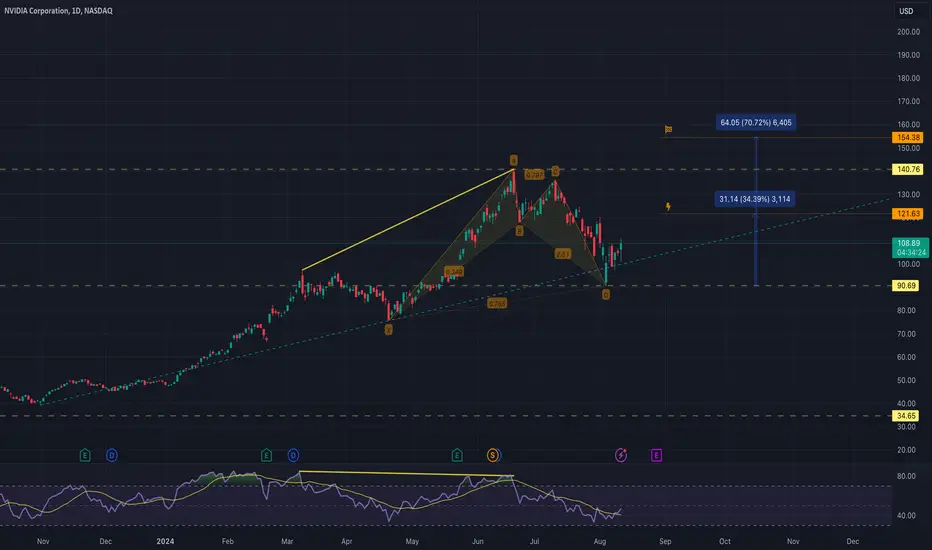
#Nvda 1D chart;
Continues its 8-month steady rise from the beginning of the year to today
It had given the first bearish signal with its divergence in the $140 zone, which is the Ath level.
As of the $90 level, the bullish pattern started and the target points are as in the chart.
Continues its 8-month steady rise from the beginning of the year to today
It had given the first bearish signal with its divergence in the $140 zone, which is the Ath level.
As of the $90 level, the bullish pattern started and the target points are as in the chart.

For more you can follow me on X. @UgurTash
免責事項
これらの情報および投稿は、TradingViewが提供または承認する金融、投資、取引、またはその他の種類の助言もしくは推奨であることを意図したものではなく、またこれらに該当するものでもありません。詳細は利用規約をご覧ください。
For more you can follow me on X. @UgurTash
免責事項
これらの情報および投稿は、TradingViewが提供または承認する金融、投資、取引、またはその他の種類の助言もしくは推奨であることを意図したものではなく、またこれらに該当するものでもありません。詳細は利用規約をご覧ください。