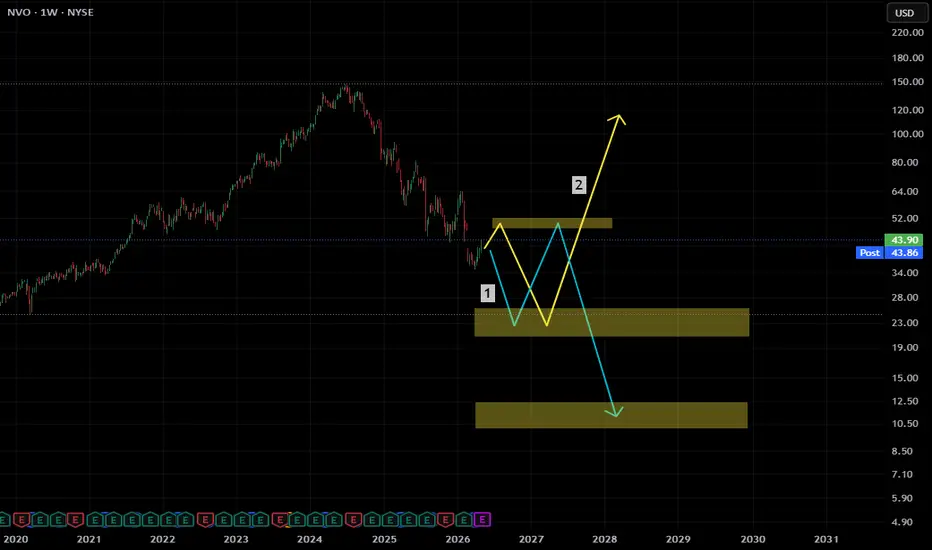
Weekly chart. A pharma giant at a crossroads.
NVO lost over 70% from its 2024 peak. The GLP-1 narrative cracked, competition arrived, and the market repriced brutally. Now at $43, it sits just above two major demand zones.
Two scenarios on the table:
Scenario 1 (yellow) : Capitulation into the $22 zone, a bounce back toward $48–$52 resistance, then rejection and a final flush into the deeper $10.50–$12.50 zone. The full reset. Classic distribution-to-markdown sequence.
Scenario 2 (cyan) : The trap. A drop into $22 first, followed by a genuine recovery that reclaims $48–$52 and launches toward $100+. The people who sold the bottom fund the next bull run.
The $22 zone is the fulcrum. How price behaves there tells the story.
This is not a trade call. This is structure reading on a name that went from darling to wreckage in 12 months. The system watches. The zones are marked.
When the signal comes, the rules decide.
Follow, Boost, Thank You!
⚠️ Financial Disclaimer: This post is not financial advice. I am not your financial advisor, your life coach, or your legally responsible adult. Always do your own research and never trade based solely on internet comedy.
トレード稼働中
 NVO now on the 4th week at the resistance... let´s see what´s coming

免責事項
これらの情報および投稿は、TradingViewが提供または承認する金融、投資、取引、またはその他の種類の助言もしくは推奨であることを意図したものではなく、またこれらに該当するものでもありません。詳細は利用規約をご覧ください。
免責事項
これらの情報および投稿は、TradingViewが提供または承認する金融、投資、取引、またはその他の種類の助言もしくは推奨であることを意図したものではなく、またこれらに該当するものでもありません。詳細は利用規約をご覧ください。