

"NZDCAD: the last impulse of the down move?" by ThinkingAntsOk
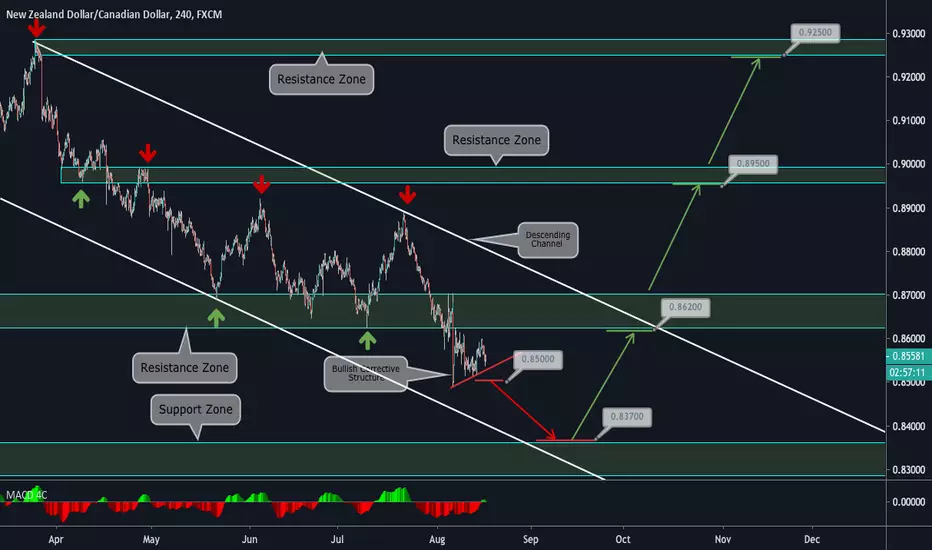
4H CHART EXPLANATION:
- In Weekly Terms, we observe a lateralization in this instrument since 2014.
- In April 19', it started its down move towards the level in which it is now.
- Price is on an a Descending Channel.
- It is currently on a Bearish Corrective Structure. If it breaks it at 0,85, it has potential to move down towards the Support Zone at 0,837.
- After this, we expect price to move up.
Check out our Weekly and Daily Vision, that support our short idea!
Weekly Vision:

Daily Vision:

- In Weekly Terms, we observe a lateralization in this instrument since 2014.
- In April 19', it started its down move towards the level in which it is now.
- Price is on an a Descending Channel.
- It is currently on a Bearish Corrective Structure. If it breaks it at 0,85, it has potential to move down towards the Support Zone at 0,837.
- After this, we expect price to move up.
Check out our Weekly and Daily Vision, that support our short idea!
Weekly Vision:
Daily Vision:

免責事項
これらの情報および投稿は、TradingViewが提供または承認する金融、投資、取引、またはその他の種類の助言もしくは推奨であることを意図したものではなく、またこれらに該当するものでもありません。詳細は利用規約をご覧ください。
免責事項
これらの情報および投稿は、TradingViewが提供または承認する金融、投資、取引、またはその他の種類の助言もしくは推奨であることを意図したものではなく、またこれらに該当するものでもありません。詳細は利用規約をご覧ください。