

Hey guys,
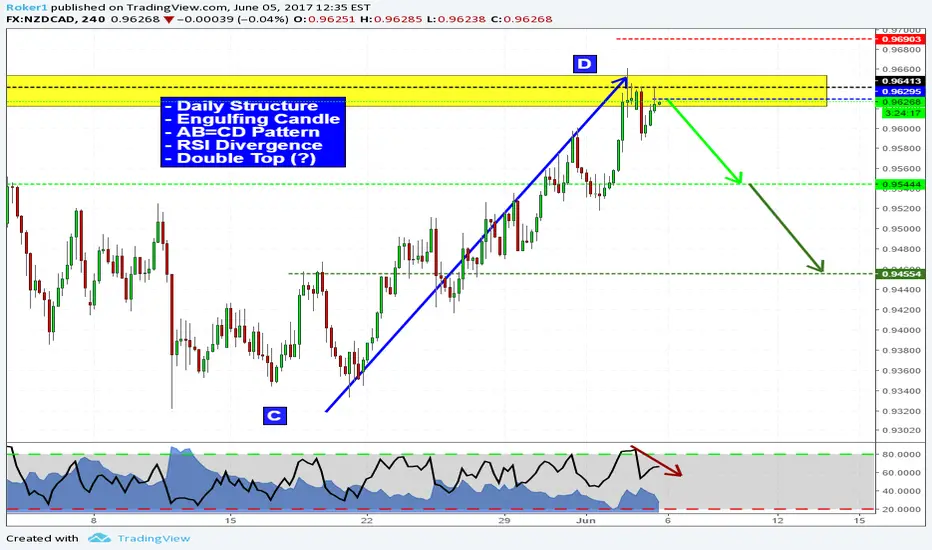
this is the 4hr chart on NZDCAD but my analysis, as usual, starts from higher timeframes: on the daily price has just touched a key level of structure (yellow box) along with the D point of an AB=CD pattern. As we go on lower timeframes such as 4hr you can see price has formed a pinbar followed by an engulfing red candle in overbought condition. Then at the retest of the highs we see RSI divergence and less strength in price action.
These are all good signs for a reversal. Let's see how it plays out.
Stops above highs, targets as displayed above.
If you have any question or if you want to share your view, feel free to comment below.
Otherwise, see you in the next chart!
this is the 4hr chart on NZDCAD but my analysis, as usual, starts from higher timeframes: on the daily price has just touched a key level of structure (yellow box) along with the D point of an AB=CD pattern. As we go on lower timeframes such as 4hr you can see price has formed a pinbar followed by an engulfing red candle in overbought condition. Then at the retest of the highs we see RSI divergence and less strength in price action.
These are all good signs for a reversal. Let's see how it plays out.
Stops above highs, targets as displayed above.
If you have any question or if you want to share your view, feel free to comment below.
Otherwise, see you in the next chart!
トレード終了: ストップロスに到達

免責事項
これらの情報および投稿は、TradingViewが提供または承認する金融、投資、取引、またはその他の種類の助言もしくは推奨であることを意図したものではなく、またこれらに該当するものでもありません。詳細は利用規約をご覧ください。
免責事項
これらの情報および投稿は、TradingViewが提供または承認する金融、投資、取引、またはその他の種類の助言もしくは推奨であることを意図したものではなく、またこれらに該当するものでもありません。詳細は利用規約をご覧ください。