

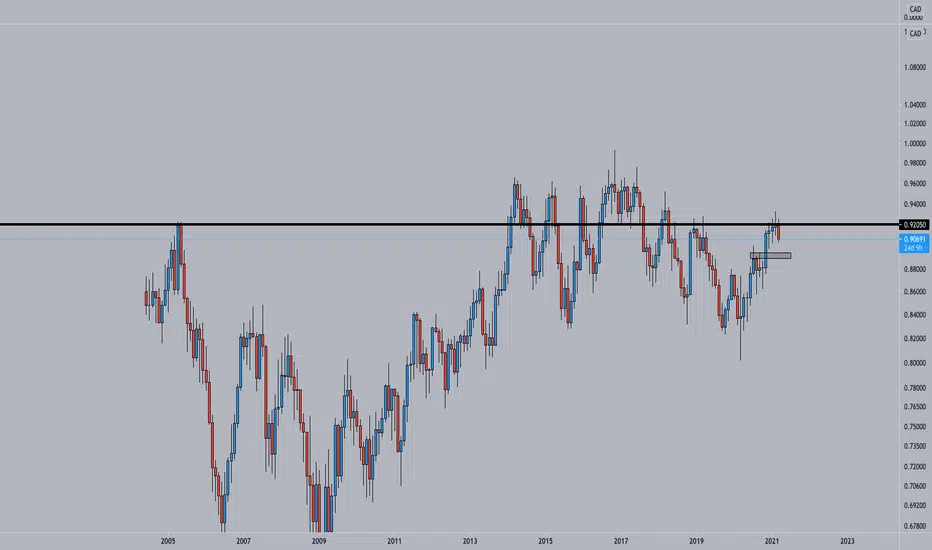
On the Monthly chart you can clearly see that we are sitting in a Supply & Demand region, acting as resistance.
This is a zone where our main bias will always be short.
You can see what this zone has triggered in the past.
Also we have received a solid bearish candle on the Monthly chart.
These are indications for a possible short set-up.
This is a zone where our main bias will always be short.
You can see what this zone has triggered in the past.
Also we have received a solid bearish candle on the Monthly chart.
These are indications for a possible short set-up.
ノート
On the Weekly chart, you can see we were making HHs and HLs. This was pretty corrective price action (with the trend) as you can see.
This is an indication that the bears are gaining power.
We have received multiple Weekly Fib completions.
We have received a break of the ascending trend (line) and the last HL.
These were also indications for a short set-up.
ノート
On the Daily chart, you can also see that we broke the ascending trend (line) and the last HL. We have received a solid bearish impulse to the downside.
We do expect a Bearish W pattern as confirmation.
My entry would be around the white box region as this is a very clear Supply & Demand zone.
On the 4H i will determine my precise entry if we do receive a Daily pattern first.

免責事項
これらの情報および投稿は、TradingViewが提供または承認する金融、投資、取引、またはその他の種類の助言もしくは推奨であることを意図したものではなく、またこれらに該当するものでもありません。詳細は利用規約をご覧ください。
免責事項
これらの情報および投稿は、TradingViewが提供または承認する金融、投資、取引、またはその他の種類の助言もしくは推奨であることを意図したものではなく、またこれらに該当するものでもありません。詳細は利用規約をご覧ください。