

NZD/CAD:SELL From 61.8% FIBO Resistance AREA DIV RSI SHORT
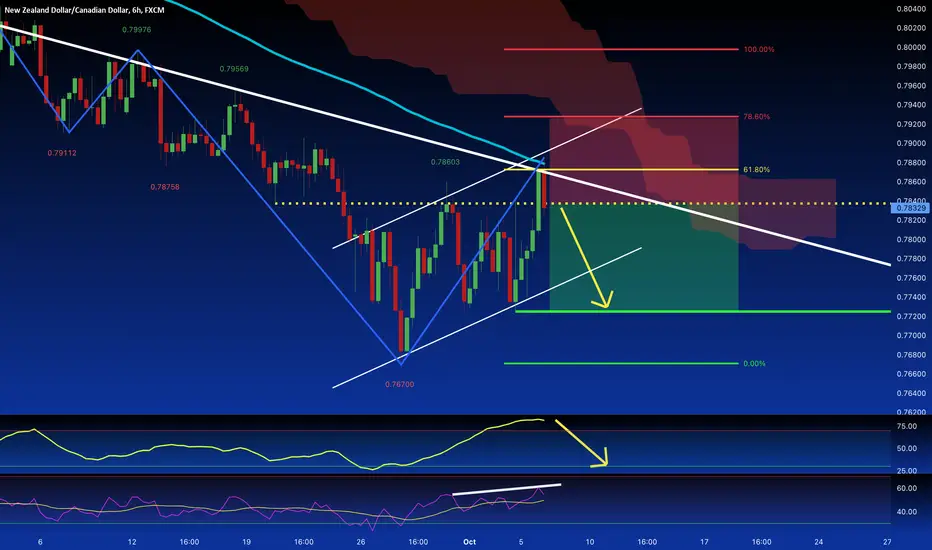
NZD/CAD comes from a solid bearish trend, in the last sessions, the price had a retracement to the 61.8% Fibonacci retracement whereas today the market opened with a strong bearish candle. At this price, the level is placed some static resistance and the dynamic trendline. The 100 Moving average had worked like a rebound point where the candle turned bearish and the indicators, the RSI ( in divergence ), and the Stochastic show a drop-down pattern.
ノート

免責事項
これらの情報および投稿は、TradingViewが提供または承認する金融、投資、取引、またはその他の種類の助言もしくは推奨であることを意図したものではなく、またこれらに該当するものでもありません。詳細は利用規約をご覧ください。
免責事項
これらの情報および投稿は、TradingViewが提供または承認する金融、投資、取引、またはその他の種類の助言もしくは推奨であることを意図したものではなく、またこれらに該当するものでもありません。詳細は利用規約をご覧ください。