

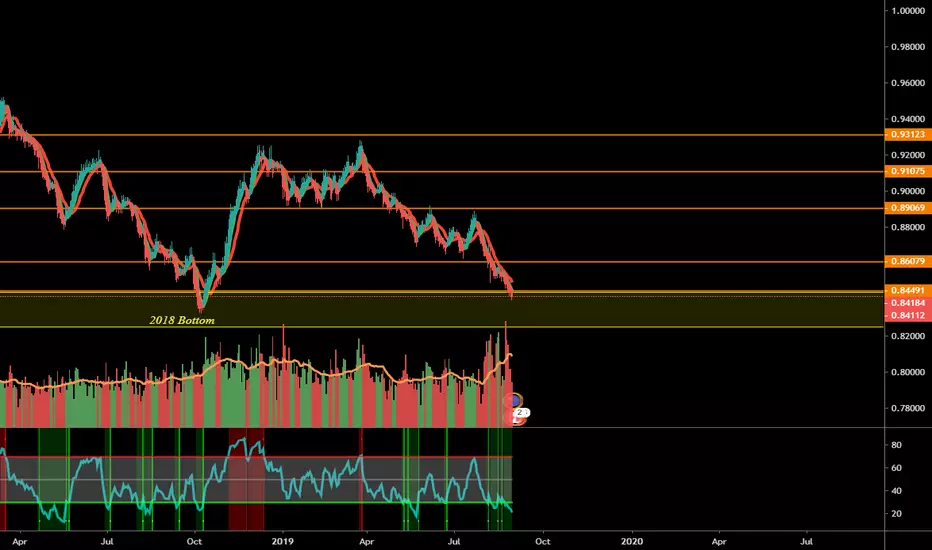
NZD/CAD after finding the bottom in OCT-2018 it did 918 pips within 63 Days.
As it was also the same bottom back there in Sep-2015 and with 459 Days it did above 1600 pips.
Now it is testing the same area which can also be considered as the triple bottom
At least expecting 500 Pips in the long term from here.
Note- Wait for a bullish crossover, Rsi showing uptrend!
As it was also the same bottom back there in Sep-2015 and with 459 Days it did above 1600 pips.
Now it is testing the same area which can also be considered as the triple bottom
At least expecting 500 Pips in the long term from here.
Note- Wait for a bullish crossover, Rsi showing uptrend!

免責事項
これらの情報および投稿は、TradingViewが提供または承認する金融、投資、取引、またはその他の種類の助言もしくは推奨であることを意図したものではなく、またこれらに該当するものでもありません。詳細は利用規約をご覧ください。
免責事項
これらの情報および投稿は、TradingViewが提供または承認する金融、投資、取引、またはその他の種類の助言もしくは推奨であることを意図したものではなく、またこれらに該当するものでもありません。詳細は利用規約をご覧ください。