

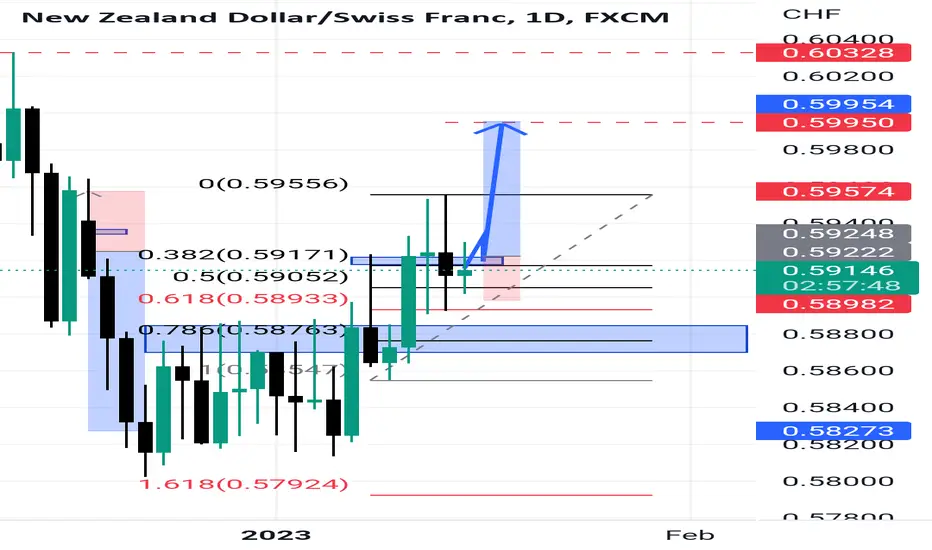
A quick Top down analysis on the NZDCHF, from the monthly timeframe down to the Daily timeframe....starting from the Monthly we see the market is rejecting a major support, on the weekly timeframe we can see a market that is creating a series of higher highs and higher lows, on the Daily time we are already seeing a market rejecting the 0.618 fib level....so for our entry timeframe, we'd be monitoring a break of the neckline of the double bottom forming....after the we can set our buy order

免責事項
これらの情報および投稿は、TradingViewが提供または承認する金融、投資、取引、またはその他の種類の助言もしくは推奨であることを意図したものではなく、またこれらに該当するものでもありません。詳細は利用規約をご覧ください。
免責事項
これらの情報および投稿は、TradingViewが提供または承認する金融、投資、取引、またはその他の種類の助言もしくは推奨であることを意図したものではなく、またこれらに該当するものでもありません。詳細は利用規約をご覧ください。