

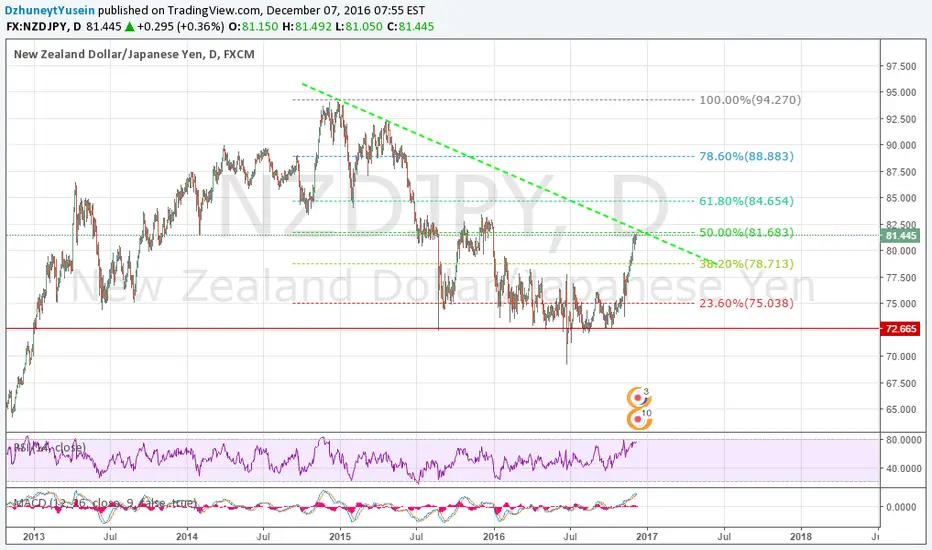
Similar to CADJPY, NZDJPY reached resistance level. This level coincides with Fibonacci level which determines the likely end points of retracements. As you can see, since mid-2015 NJ has been in a downward trend and recent increase represents the retracement which is likely to be over (reached resistance and 50% Fib level).
As argued in previous post for CADJPY, a weak yen is actually over-valued and is hurting the economy through investment outflow channel.
RSI and MACD also suggest end of retracement. Good short. If trend and Fib level broken, traders could see potential for long on that pair (not likely imo due to reasons listed above). Good luck!
As argued in previous post for CADJPY, a weak yen is actually over-valued and is hurting the economy through investment outflow channel.
RSI and MACD also suggest end of retracement. Good short. If trend and Fib level broken, traders could see potential for long on that pair (not likely imo due to reasons listed above). Good luck!

関連の投稿
免責事項
これらの情報および投稿は、TradingViewが提供または承認する金融、投資、取引、またはその他の種類の助言もしくは推奨であることを意図したものではなく、またこれらに該当するものでもありません。詳細は利用規約をご覧ください。
免責事項
これらの情報および投稿は、TradingViewが提供または承認する金融、投資、取引、またはその他の種類の助言もしくは推奨であることを意図したものではなく、またこれらに該当するものでもありません。詳細は利用規約をご覧ください。