

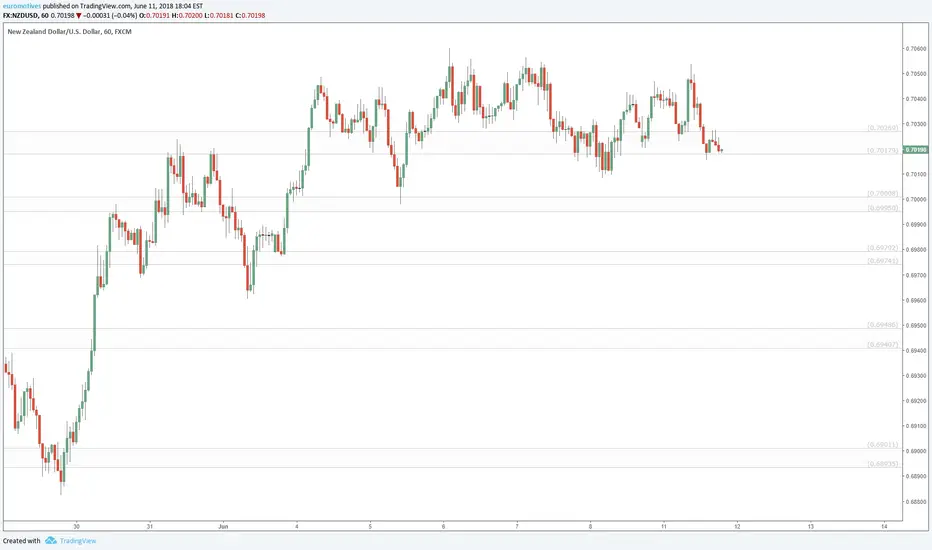
These zones are calculated using Fibonacci Ratios of past price moves.
Where prices overlap, drag the Right (price) Axis up to magnify and reduce overlap vertically.
There are zones above and below the current window, Drag the Chart up/down to see other zones.
Drag bottom axis to the left to magnify the candle size to view close up.
I will update as new zones are defined by upcoming Fibs.
Where prices overlap, drag the Right (price) Axis up to magnify and reduce overlap vertically.
There are zones above and below the current window, Drag the Chart up/down to see other zones.
Drag bottom axis to the left to magnify the candle size to view close up.
I will update as new zones are defined by upcoming Fibs.
ノート
Even in times of high volatility (FOMC decision/conference), the Fib boundaries are still obeyed.ノート
my NU zones are admitedly not so good, but looks to be headed to .685 quicklys3.amazonaws.com/tradingview/snapshots/0/0dSRKJjp.png

the Golden Ratio is my Religion
the Trading View is my Nation
the Moderator Tag is my Flag
the Trading View is my Nation
the Moderator Tag is my Flag
関連の投稿
免責事項
これらの情報および投稿は、TradingViewが提供または承認する金融、投資、取引、またはその他の種類の助言もしくは推奨であることを意図したものではなく、またこれらに該当するものでもありません。詳細は利用規約をご覧ください。
the Golden Ratio is my Religion
the Trading View is my Nation
the Moderator Tag is my Flag
the Trading View is my Nation
the Moderator Tag is my Flag
関連の投稿
免責事項
これらの情報および投稿は、TradingViewが提供または承認する金融、投資、取引、またはその他の種類の助言もしくは推奨であることを意図したものではなく、またこれらに該当するものでもありません。詳細は利用規約をご覧ください。