

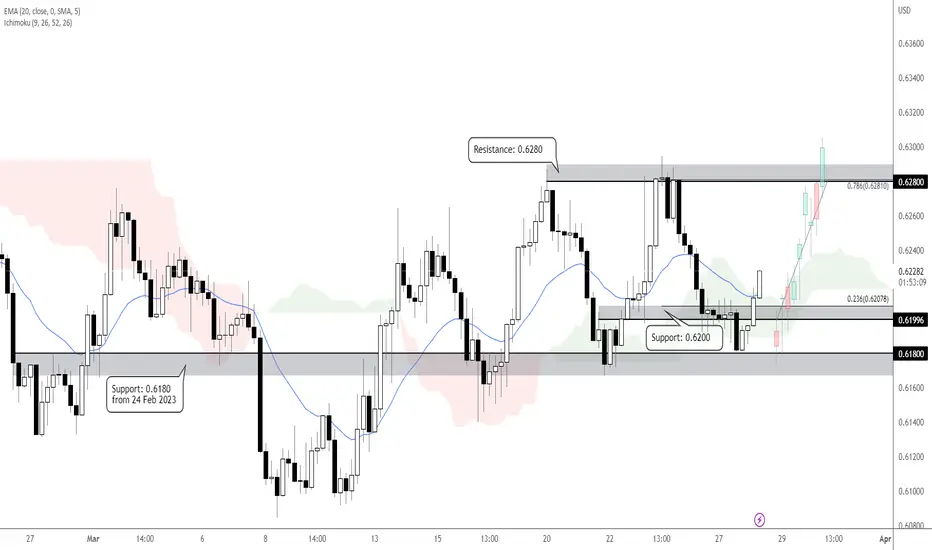
Prices are hovering above a key support zone at 0.6200 on the H4 timeframe. A throwback to this support zone, which coincides with the 23.6% Fibonacci retracement, could provide the bullish acceleration to the resistance zone at 0.6280, in line with the 78.6% Fibonacci extension. Price is holding above the 20 EMA and Ichimoku cloud, supporting our bullish bias.

免責事項
これらの情報および投稿は、TradingViewが提供または承認する金融、投資、取引、またはその他の種類の助言もしくは推奨であることを意図したものではなく、またこれらに該当するものでもありません。詳細は利用規約をご覧ください。
免責事項
これらの情報および投稿は、TradingViewが提供または承認する金融、投資、取引、またはその他の種類の助言もしくは推奨であることを意図したものではなく、またこれらに該当するものでもありません。詳細は利用規約をご覧ください。