
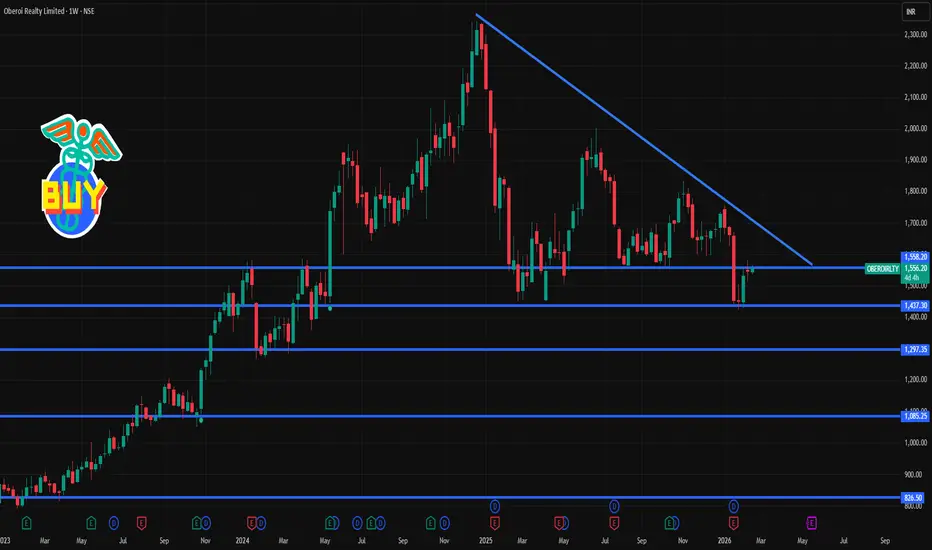
📍 Current Price (approx): ~₹1,560 – ₹1,565 on Feb 16 (based on latest exchange data)
📈 Weekly Support & Resistance Levels
1-Week (16 – 20 Feb 2026)
🔹 Immediate Resistance Levels
R1: ₹1,581.83 — near-term upside barrier
R2: ₹1,616.07 — next bullish test
R3: ₹1,649.33 — extended resistance if breakout sustains
🔸 Immediate Support Levels
S1: ₹1,514.33 — key near-term support
S2: ₹1,481.07 — secondary downside level
S3: ₹1,446.83 — deeper support range for weak price action
📊 Weekly Expected Trading Range:
₹1,447 – ₹1,649 (typical range without strong news impact).
📌 How to Use These Levels (Weekly Context)
Bullish Scenario
If Oberoi Realty closes above ₹1,581.83 on weekly basis → bullish continuation likely
Break above ₹1,616–₹1,649 increases probability of further upside momentum.
Bearish Scenario
If price breaks below ₹1,514.33 → downside might accelerate
Sustained weakness could target ₹1,481 then ₹1,447.
🧠 Intermediate Technical Context
Daily support/resistance (classic pivot method) also suggests shorter intraday levels (good for trade timing):
S1: ~₹1,545–₹1,550
S2: ~₹1,526–₹1,514
Pivot: ~₹1,558–₹1,560
R1: ~₹1,577–₹1,589
R2: ~₹1,589–₹1,608
This daily pivot cluster feeds into broader weekly zones.
📊 Technical Indicator Snapshot (Recent)
Moving averages (20/50/100/200) around current price — trading mostly neutral with slight resistance overhead.
Oscillators like RSI near neutral (~50), suggesting neither strongly overbought nor oversold conditions.
📈 Weekly Support & Resistance Levels
1-Week (16 – 20 Feb 2026)
🔹 Immediate Resistance Levels
R1: ₹1,581.83 — near-term upside barrier
R2: ₹1,616.07 — next bullish test
R3: ₹1,649.33 — extended resistance if breakout sustains
🔸 Immediate Support Levels
S1: ₹1,514.33 — key near-term support
S2: ₹1,481.07 — secondary downside level
S3: ₹1,446.83 — deeper support range for weak price action
📊 Weekly Expected Trading Range:
₹1,447 – ₹1,649 (typical range without strong news impact).
📌 How to Use These Levels (Weekly Context)
Bullish Scenario
If Oberoi Realty closes above ₹1,581.83 on weekly basis → bullish continuation likely
Break above ₹1,616–₹1,649 increases probability of further upside momentum.
Bearish Scenario
If price breaks below ₹1,514.33 → downside might accelerate
Sustained weakness could target ₹1,481 then ₹1,447.
🧠 Intermediate Technical Context
Daily support/resistance (classic pivot method) also suggests shorter intraday levels (good for trade timing):
S1: ~₹1,545–₹1,550
S2: ~₹1,526–₹1,514
Pivot: ~₹1,558–₹1,560
R1: ~₹1,577–₹1,589
R2: ~₹1,589–₹1,608
This daily pivot cluster feeds into broader weekly zones.
📊 Technical Indicator Snapshot (Recent)
Moving averages (20/50/100/200) around current price — trading mostly neutral with slight resistance overhead.
Oscillators like RSI near neutral (~50), suggesting neither strongly overbought nor oversold conditions.

Contact Knowledgehub for a detailed consultation: Dm on WhatsApp: [wa.link/a2o0kz]-
Phone No: [+91 93102 26243]-
Email: [tradingviewknowledgehub@gmail.com]---
-- Let’s achieve success together!
Phone No: [+91 93102 26243]-
Email: [tradingviewknowledgehub@gmail.com]---
-- Let’s achieve success together!
関連の投稿
免責事項
これらの情報および投稿は、TradingViewが提供または承認する金融、投資、取引、またはその他の種類の助言もしくは推奨であることを意図したものではなく、またこれらに該当するものでもありません。詳細は利用規約をご覧ください。
Contact Knowledgehub for a detailed consultation: Dm on WhatsApp: [wa.link/a2o0kz]-
Phone No: [+91 93102 26243]-
Email: [tradingviewknowledgehub@gmail.com]---
-- Let’s achieve success together!
Phone No: [+91 93102 26243]-
Email: [tradingviewknowledgehub@gmail.com]---
-- Let’s achieve success together!
関連の投稿
免責事項
これらの情報および投稿は、TradingViewが提供または承認する金融、投資、取引、またはその他の種類の助言もしくは推奨であることを意図したものではなく、またこれらに該当するものでもありません。詳細は利用規約をご覧ください。