
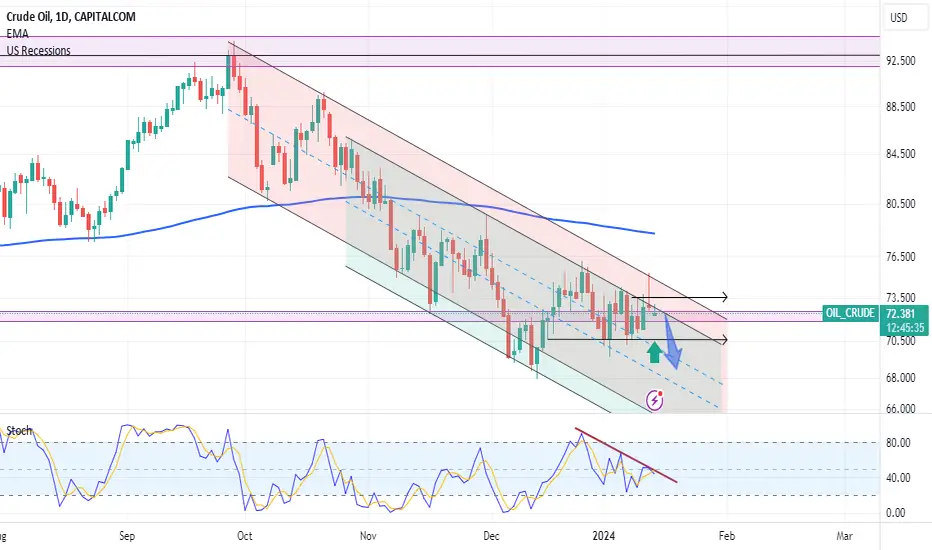
The bearish move that we see in this chart, which started on September 28th, has formed two bearish channels, preventing the price from going higher seven times so far.
As you can see on Friday, January 12th, with the geopolitical news from the Red Sea conflict, the price attempted to form a bullish breakout of the smaller channel but got rejected from the larger channel.
As a result of this rejection, not only did the price form a daily shooting star candlestick pattern, but also the bullish breakout now seems like a false breakout, signaling the potential for further bearish movement in oil.
We can also see that we have a bearish trendline on Stochastic oscillator which also bring more selling pressure on this commodity.
If you've found this analysis helpful, please take a moment to like, comment, or share your thoughts with me.
As you can see on Friday, January 12th, with the geopolitical news from the Red Sea conflict, the price attempted to form a bullish breakout of the smaller channel but got rejected from the larger channel.
As a result of this rejection, not only did the price form a daily shooting star candlestick pattern, but also the bullish breakout now seems like a false breakout, signaling the potential for further bearish movement in oil.
We can also see that we have a bearish trendline on Stochastic oscillator which also bring more selling pressure on this commodity.
If you've found this analysis helpful, please take a moment to like, comment, or share your thoughts with me.

関連の投稿
免責事項
これらの情報および投稿は、TradingViewが提供または承認する金融、投資、取引、またはその他の種類の助言もしくは推奨であることを意図したものではなく、またこれらに該当するものでもありません。詳細は利用規約をご覧ください。
免責事項
これらの情報および投稿は、TradingViewが提供または承認する金融、投資、取引、またはその他の種類の助言もしくは推奨であることを意図したものではなく、またこれらに該当するものでもありません。詳細は利用規約をご覧ください。