
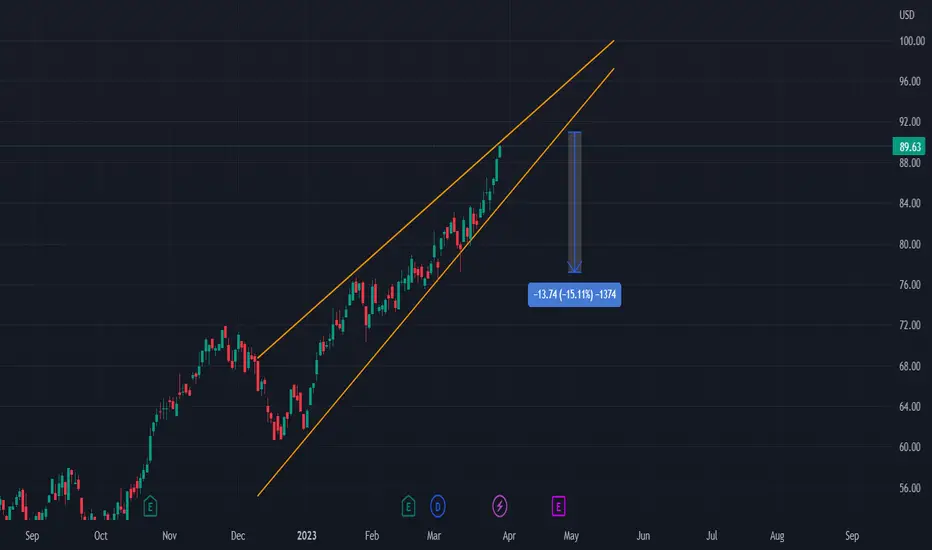
On the chart, we can see a rising wedge occurring.
OMAB is at its 52-week high, and this has been formed as a rising wedge.
We therefore expect it to have a drop to the downside.
Entry will be at the breakout of the wedge with a possible ROI of 15%
More details are shown on the chart.
OMAB is at its 52-week high, and this has been formed as a rising wedge.
We therefore expect it to have a drop to the downside.
Entry will be at the breakout of the wedge with a possible ROI of 15%
More details are shown on the chart.
トレード終了: 利益確定目標に到達
Played out as expected. Closing here as target reached almost.ノート
Next Short may be entered on the retest of the upsloping resistance (previous support)ノート
have bounced
💥 Free signals and ideas ➡ t.me/vfinvestment
関連の投稿
免責事項
これらの情報および投稿は、TradingViewが提供または承認する金融、投資、取引、またはその他の種類の助言もしくは推奨であることを意図したものではなく、またこれらに該当するものでもありません。詳細は利用規約をご覧ください。
💥 Free signals and ideas ➡ t.me/vfinvestment
関連の投稿
免責事項
これらの情報および投稿は、TradingViewが提供または承認する金融、投資、取引、またはその他の種類の助言もしくは推奨であることを意図したものではなく、またこれらに該当するものでもありません。詳細は利用規約をご覧ください。