
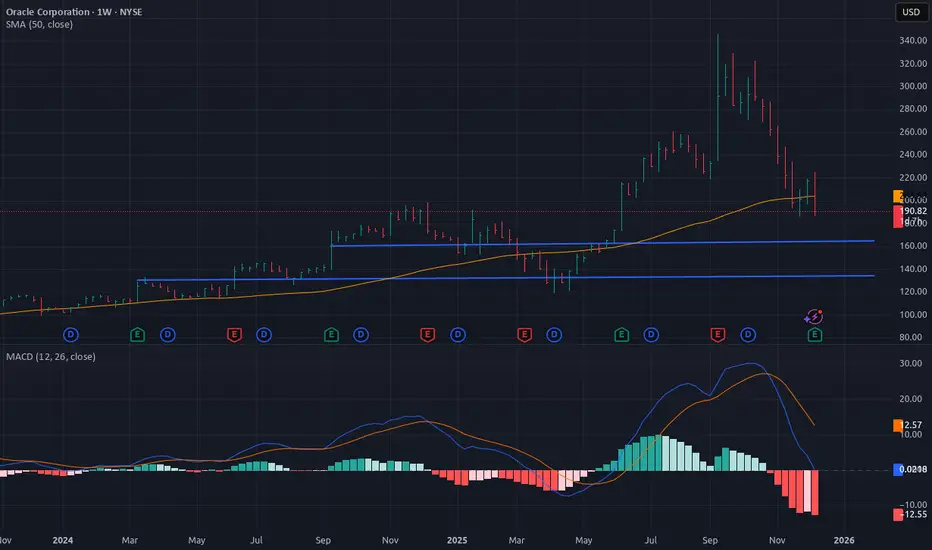
Watch out for Oracle to break the current uptrend on weekly, it's getting weaker along with the distribution on daily which has started about a month ago and still ongoing. The current weekly uptrend is still holding up but it's getting weaker and in danger for a possible downtrend, for now we need more time to see the confirmation.
Watch the blue lines as pivots to hold the support.
Watch the blue lines as pivots to hold the support.
ノート
P.S.There are many other indicators that are being used for this TA, the above snapshot is only an example.
Moreover, I've been doing technical analysis for quite some time, and I'm neither bullish nor bearish, I'm a swing trader who likes TA. And as you should know - always make your own choices.

免責事項
これらの情報および投稿は、TradingViewが提供または承認する金融、投資、取引、またはその他の種類の助言もしくは推奨であることを意図したものではなく、またこれらに該当するものでもありません。詳細は利用規約をご覧ください。
免責事項
これらの情報および投稿は、TradingViewが提供または承認する金融、投資、取引、またはその他の種類の助言もしくは推奨であることを意図したものではなく、またこれらに該当するものでもありません。詳細は利用規約をご覧ください。