
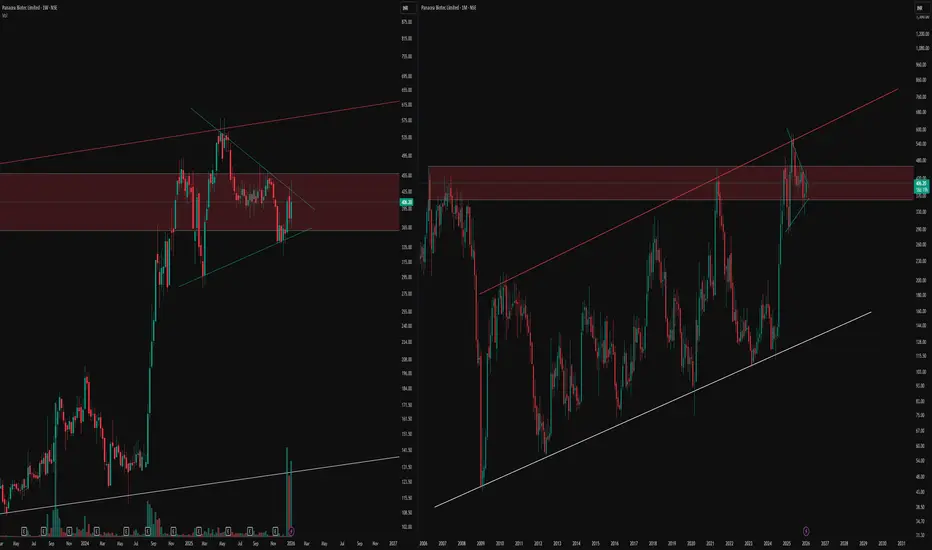
TradingView's multi-window layout reveals pristine price action across weekly and monthly charts, highlighting structural precision without forecasts.
Both timeframes demonstrate unwavering respect for key lines and zones, underscoring market geometry's reliability.
Monthly Chart Insights
The right-side monthly view features a robust supply zone where sellers dominate, enforcing repeated rejections with textbook accuracy. A white trend line provides dynamic support, paired with the red parallel channel line creating a textbook channel that price honors meticulously. This setup exemplifies how channels contain swings beautifully.
Weekly Chart Patterns
On the left, weekly timeframe displays two pivotal pattern lines: a counter trend line and a primary trend line, both tracked flawlessly through advances and retreats. These lines form the backbone of the structure, filtering noise and revealing order in motion.
Disclaimer
Purely educational analysis of past price action—no advice, signals, or predictions provided. Trading carries high risk of capital loss; perform independent due diligence and seek professional guidance.
Both timeframes demonstrate unwavering respect for key lines and zones, underscoring market geometry's reliability.
Monthly Chart Insights
The right-side monthly view features a robust supply zone where sellers dominate, enforcing repeated rejections with textbook accuracy. A white trend line provides dynamic support, paired with the red parallel channel line creating a textbook channel that price honors meticulously. This setup exemplifies how channels contain swings beautifully.
Weekly Chart Patterns
On the left, weekly timeframe displays two pivotal pattern lines: a counter trend line and a primary trend line, both tracked flawlessly through advances and retreats. These lines form the backbone of the structure, filtering noise and revealing order in motion.
Disclaimer
Purely educational analysis of past price action—no advice, signals, or predictions provided. Trading carries high risk of capital loss; perform independent due diligence and seek professional guidance.

🎁 Get 1–2 free swing picks/month on Telegram:
t.me/hashtaghammer
📲 Enquire about stock recommendation services - WhatsApp “Hi”
wa.me/919455664601
Apoorv Dubey | SEBI RA | INH000030287
t.me/hashtaghammer
📲 Enquire about stock recommendation services - WhatsApp “Hi”
wa.me/919455664601
Apoorv Dubey | SEBI RA | INH000030287
関連の投稿
免責事項
これらの情報および投稿は、TradingViewが提供または承認する金融、投資、取引、またはその他の種類の助言もしくは推奨であることを意図したものではなく、またこれらに該当するものでもありません。詳細は利用規約をご覧ください。
🎁 Get 1–2 free swing picks/month on Telegram:
t.me/hashtaghammer
📲 Enquire about stock recommendation services - WhatsApp “Hi”
wa.me/919455664601
Apoorv Dubey | SEBI RA | INH000030287
t.me/hashtaghammer
📲 Enquire about stock recommendation services - WhatsApp “Hi”
wa.me/919455664601
Apoorv Dubey | SEBI RA | INH000030287
関連の投稿
免責事項
これらの情報および投稿は、TradingViewが提供または承認する金融、投資、取引、またはその他の種類の助言もしくは推奨であることを意図したものではなく、またこれらに該当するものでもありません。詳細は利用規約をご覧ください。