
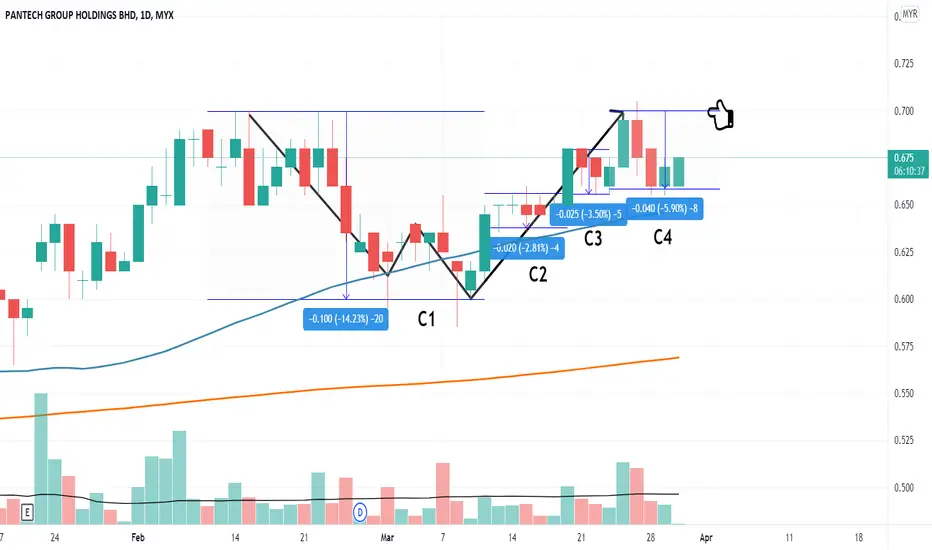
PANTECH showing VCP setup with below contraction:
C1: -14%
C2: -3%
C3: -3%
C4: -6%
At the same time, chart also showing a double bottom setup (Black line path)
Handle forming in progress. Let's see if can breakout previous high or not.
Disclaimer:
Not buy call recommendation. Technical analysis sharing based on chart pattern and trend. Trade at your own risk.
C1: -14%
C2: -3%
C3: -3%
C4: -6%
At the same time, chart also showing a double bottom setup (Black line path)
Handle forming in progress. Let's see if can breakout previous high or not.
Disclaimer:
Not buy call recommendation. Technical analysis sharing based on chart pattern and trend. Trade at your own risk.

関連の投稿
免責事項
これらの情報および投稿は、TradingViewが提供または承認する金融、投資、取引、またはその他の種類の助言もしくは推奨であることを意図したものではなく、またこれらに該当するものでもありません。詳細は利用規約をご覧ください。
免責事項
これらの情報および投稿は、TradingViewが提供または承認する金融、投資、取引、またはその他の種類の助言もしくは推奨であることを意図したものではなく、またこれらに該当するものでもありません。詳細は利用規約をご覧ください。