
PARAS: Daily Rectangular Base Breakout & Fundamental Catalyst
1. The Macro Perspective: The Rectangular Consolidation Base
I am taking a LONG bias on Paras Defence & Space Technologies Ltd. (PARAS) on the daily (1D) timeframe
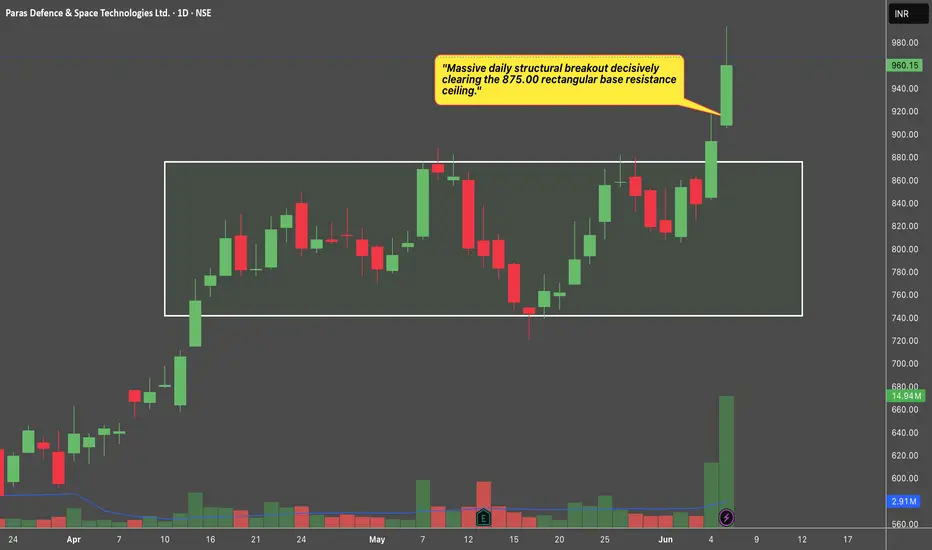
When analyzing pure market structure on a high-growth defence and aerospace stock, extended accumulation bases are critical for absorbing supply before initiating the next leg of a secular markup. Following a prior run-up, the stock entered a massive structural consolidation phase spanning several weeks, carving out a highly defined rectangular Darvas Box. This digestion phase flushed out weak hands and allowed institutional capital to quietly accumulate shares at steady valuations. Fundamentally, this fierce technical momentum aligns flawlessly with the company's strong Q4 FY26 results, where consolidated PAT surged 75% YoY to ₹34.5 crore and revenue jumped 54.5% YoY to ₹170 crore. Furthermore, the company recently secured a high-precision ₹52.82 crore contract from BEL for electro-optics supply, underscoring robust demand. Documenting these classical accumulation bases makes the charting workflow highly repeatable for anyone analyzing momentum shifts.
2. The Educational Setup: Horizontal Resistance & Structural Support
To understand the technical validity behind this macro launch, look closely at how the price structure interacted with its core boundaries:
The 875.00 Resistance Ceiling: The definitive line in the sand for a bullish structural shift was the top of the rectangular box drawn near 875.00. This level established a solid supply zone that systematically capped upward momentum over the consolidation period.
The 745.00 Structural Support: During the consolidation, buyers established clear support near the 745.00 zone, marked by the lower boundary of the box. The price action oscillated cleanly between these two boundaries, gradually building immense kinetic energy.
3. Current Price Action: Breakout and Volatility Expansion
Look at the most recent daily candle on the far right of the chart. The structural pressure cooker has officially exploded. Institutional buyers have stepped in with undeniable conviction, backed by a massive volume expansion. The stock printed a towering, full-bodied green expansion candle that has decisively obliterated the 875.00 ceiling, currently trading incredibly strong near 960.15 (+7.42% on the session) after hitting an intraday high of 994.00. The stock has officially transitioned out of accumulation and into a highly explosive markup trend into fresh territory.
Note: Always ensure your exchange's End of Day (EOD) data files have fully synchronized before confirming the final daily close shape, as evening data synchronization delays can occasionally alter the visual confirmation of these critical breakout wicks.
4. The Trade Plan: Entries, Targets, and Risk Management
Entry Strategy: Momentum is exceptionally strong with the stock trading vertically out in the open above the pivotal breakout line. Chasing an extended daily breakout candle carries a minor risk of a short-term mean-reversion pullback. The highest-probability, lowest-risk entry strategy involves waiting for the initial vertical excitement to cool off. Look to scale into long positions on a potential structural pullback to perfectly retest the broken 860.00 to 880.00 prior resistance zone. Letting old historical resistance prove itself as a concrete new support floor provides an unmatched risk-to-reward ratio.
Take Profit (Targets): By utilizing a classical measured move strategy based on the structural depth of the rectangular base, we can project upside targets. Taking the approximate depth of the base (roughly 130 points from the 745.00 floor up to the 875.00 ceiling) and projecting it upward from the breakout point, our primary structural target sits comfortably in the 1,000.00 to 1,020.00 zone over the coming weeks.
Invalidation (Stop Loss): An explosive breakout thesis is completely invalidated if the price fails to hold its newly claimed structural floor and collapses back inside the core of the base boundaries. A hard stop loss should be placed safely below the mid-line of the consolidation box, specifically around the 800.00 to 810.00 level. A definitive daily close completely back below 800.00 would act as a severe warning sign of a failed breakout and a major bull trap.
5. Time Horizon:
Because this technical setup captures a clear structural phase transition and a textbook rectangular box breakout on the 1-Day chart, this is a high-alpha swing trade designed to capture a rapid momentum markup phase over the coming weeks. Let the trend run!
I am taking a LONG bias on Paras Defence & Space Technologies Ltd. (PARAS) on the daily (1D) timeframe
When analyzing pure market structure on a high-growth defence and aerospace stock, extended accumulation bases are critical for absorbing supply before initiating the next leg of a secular markup. Following a prior run-up, the stock entered a massive structural consolidation phase spanning several weeks, carving out a highly defined rectangular Darvas Box. This digestion phase flushed out weak hands and allowed institutional capital to quietly accumulate shares at steady valuations. Fundamentally, this fierce technical momentum aligns flawlessly with the company's strong Q4 FY26 results, where consolidated PAT surged 75% YoY to ₹34.5 crore and revenue jumped 54.5% YoY to ₹170 crore. Furthermore, the company recently secured a high-precision ₹52.82 crore contract from BEL for electro-optics supply, underscoring robust demand. Documenting these classical accumulation bases makes the charting workflow highly repeatable for anyone analyzing momentum shifts.
2. The Educational Setup: Horizontal Resistance & Structural Support
To understand the technical validity behind this macro launch, look closely at how the price structure interacted with its core boundaries:
The 875.00 Resistance Ceiling: The definitive line in the sand for a bullish structural shift was the top of the rectangular box drawn near 875.00. This level established a solid supply zone that systematically capped upward momentum over the consolidation period.
The 745.00 Structural Support: During the consolidation, buyers established clear support near the 745.00 zone, marked by the lower boundary of the box. The price action oscillated cleanly between these two boundaries, gradually building immense kinetic energy.
3. Current Price Action: Breakout and Volatility Expansion
Look at the most recent daily candle on the far right of the chart. The structural pressure cooker has officially exploded. Institutional buyers have stepped in with undeniable conviction, backed by a massive volume expansion. The stock printed a towering, full-bodied green expansion candle that has decisively obliterated the 875.00 ceiling, currently trading incredibly strong near 960.15 (+7.42% on the session) after hitting an intraday high of 994.00. The stock has officially transitioned out of accumulation and into a highly explosive markup trend into fresh territory.
Note: Always ensure your exchange's End of Day (EOD) data files have fully synchronized before confirming the final daily close shape, as evening data synchronization delays can occasionally alter the visual confirmation of these critical breakout wicks.
4. The Trade Plan: Entries, Targets, and Risk Management
Entry Strategy: Momentum is exceptionally strong with the stock trading vertically out in the open above the pivotal breakout line. Chasing an extended daily breakout candle carries a minor risk of a short-term mean-reversion pullback. The highest-probability, lowest-risk entry strategy involves waiting for the initial vertical excitement to cool off. Look to scale into long positions on a potential structural pullback to perfectly retest the broken 860.00 to 880.00 prior resistance zone. Letting old historical resistance prove itself as a concrete new support floor provides an unmatched risk-to-reward ratio.
Take Profit (Targets): By utilizing a classical measured move strategy based on the structural depth of the rectangular base, we can project upside targets. Taking the approximate depth of the base (roughly 130 points from the 745.00 floor up to the 875.00 ceiling) and projecting it upward from the breakout point, our primary structural target sits comfortably in the 1,000.00 to 1,020.00 zone over the coming weeks.
Invalidation (Stop Loss): An explosive breakout thesis is completely invalidated if the price fails to hold its newly claimed structural floor and collapses back inside the core of the base boundaries. A hard stop loss should be placed safely below the mid-line of the consolidation box, specifically around the 800.00 to 810.00 level. A definitive daily close completely back below 800.00 would act as a severe warning sign of a failed breakout and a major bull trap.
5. Time Horizon:
Because this technical setup captures a clear structural phase transition and a textbook rectangular box breakout on the 1-Day chart, this is a high-alpha swing trade designed to capture a rapid momentum markup phase over the coming weeks. Let the trend run!
トレード終了: 利益確定目標に到達
Target already achieved.
免責事項
これらの情報および投稿は、TradingViewが提供または承認する金融、投資、取引、またはその他の種類の助言もしくは推奨であることを意図したものではなく、またこれらに該当するものでもありません。詳細は利用規約をご覧ください。
免責事項
これらの情報および投稿は、TradingViewが提供または承認する金融、投資、取引、またはその他の種類の助言もしくは推奨であることを意図したものではなく、またこれらに該当するものでもありません。詳細は利用規約をご覧ください。