
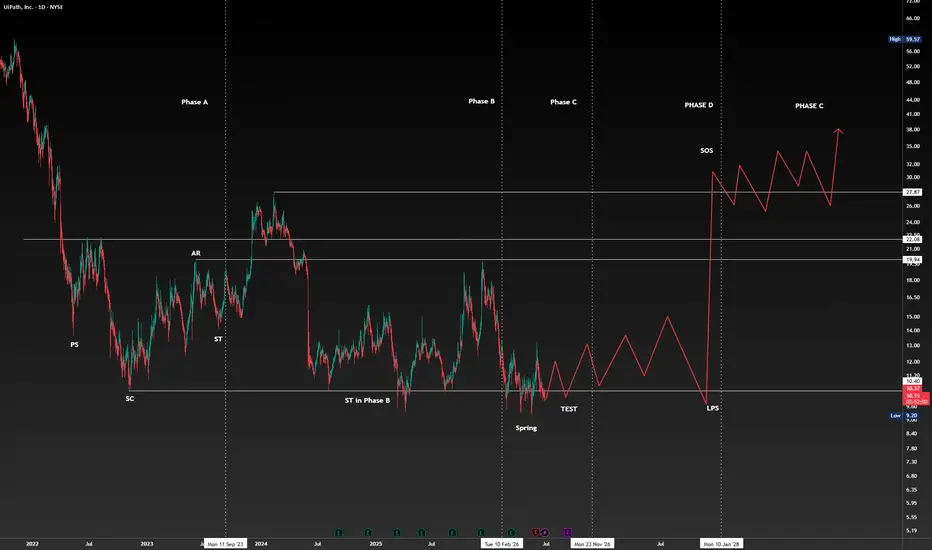
The price action of PATH appears to be unfolding within a classic Wyckoff Accumulation schematic, suggesting a potential shift from distribution to accumulation and the early stages of a bullish reversal.
🧩 Structural Breakdown
Phase A: The market shows initial stopping action with Preliminary Support (PS) and a Selling Climax (SC), signaling exhaustion of selling pressure.
Phase B: A broad trading range develops, marked by Automatic Rally (AR) and Secondary Tests (ST), where supply is being absorbed.
Phase C: A Spring/Test phase occurs — a shakeout below support that traps late sellers and confirms institutional accumulation.
Phase D: Emergence of a Sign of Strength (SOS) and Last Point of Support (LPS), where demand begins to dominate and price breaks key resistance levels.
Phase E: Expected markup phase, characterized by higher highs and higher lows as the new uptrend takes shape.
📈 Outlook
If the Wyckoff structure completes successfully, PATH could enter a sustained bullish phase. Confirmation will come with a decisive breakout above the SOS zone, supported by rising volume and successful retests of the LPS area.
🧩 Structural Breakdown
Phase A: The market shows initial stopping action with Preliminary Support (PS) and a Selling Climax (SC), signaling exhaustion of selling pressure.
Phase B: A broad trading range develops, marked by Automatic Rally (AR) and Secondary Tests (ST), where supply is being absorbed.
Phase C: A Spring/Test phase occurs — a shakeout below support that traps late sellers and confirms institutional accumulation.
Phase D: Emergence of a Sign of Strength (SOS) and Last Point of Support (LPS), where demand begins to dominate and price breaks key resistance levels.
Phase E: Expected markup phase, characterized by higher highs and higher lows as the new uptrend takes shape.
📈 Outlook
If the Wyckoff structure completes successfully, PATH could enter a sustained bullish phase. Confirmation will come with a decisive breakout above the SOS zone, supported by rising volume and successful retests of the LPS area.
ノート
Testノート
wonderfulトレード稼働中
LPS
免責事項
これらの情報および投稿は、TradingViewが提供または承認する金融、投資、取引、またはその他の種類の助言もしくは推奨であることを意図したものではなく、またこれらに該当するものでもありません。詳細は利用規約をご覧ください。
免責事項
これらの情報および投稿は、TradingViewが提供または承認する金融、投資、取引、またはその他の種類の助言もしくは推奨であることを意図したものではなく、またこれらに該当するものでもありません。詳細は利用規約をご覧ください。