
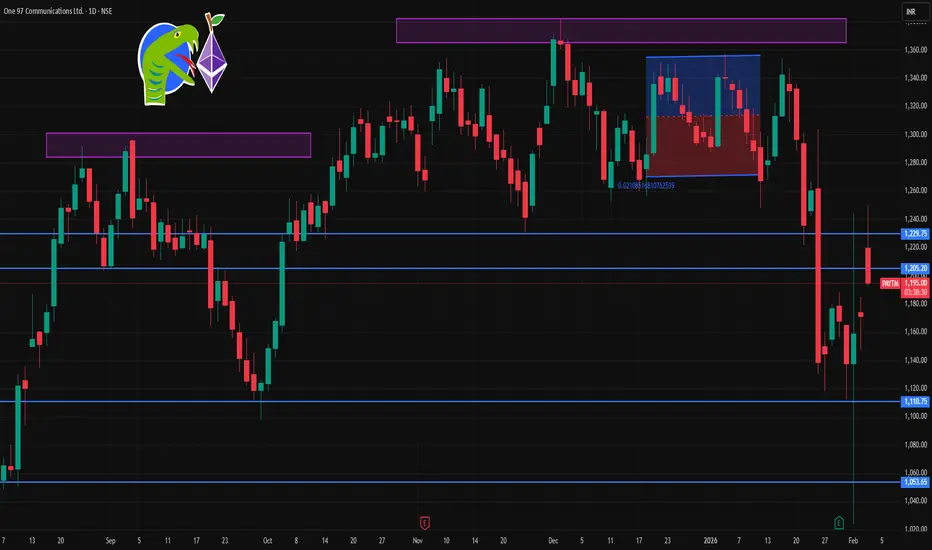
📍 Current Price (approx): ₹1,170 – ₹1,203 range (intraday movement) — fluctuating due to session volatility.
📊 Daily Support & Resistance Levels — 1‑Day Time Frame (Pivot‑based)
🟡 Pivot Point (PP): ~₹1,168–₹1,170
This is the key central level — below it bearish bias, above it bullish bias.
🔴 Upside – Resistance Levels
R1: ~₹1,188–₹1,190
R2: ~₹1,202–₹1,205
R3: ~₹1,217–₹1,225+
(Break & hold above these suggests stronger bullish continuation for the day)
🔵 Downside – Support Levels
S1: ~₹1,151–₹1,155
S2: ~₹1,130–₹1,140
S3: ~₹1,113–₹1,120
(Break below these risks faster intraday downside)
📈 Intraday Key Zones to Watch
➡️ Bullish above Pivot (~₹1,168–₹1,170) — Price may look to resistance zones at ₹1,188 → ₹1,202 → ₹1,217.
➡️ Bearish below Pivot — support zones at ₹1,151 → ₹1,130 → ₹1,113 become targets.
📌 Day Trading Bias (1D Frame)
Bullish tilt if price stays above pivot and holds above R1.
Bearish bend if price slips below S1 with follow‑through.
Intraday volatility is high (range breakout strategy often works).
🧠 Quick Notes
These levels are pivot‑based support/resistance commonly used by technical traders.
Markets move with news, volume and momentum — always trade with risk management like stop‑loss near key supports/resistances.
This is not financial advice — verify prices on your live trading platform before taking positions.
📊 Daily Support & Resistance Levels — 1‑Day Time Frame (Pivot‑based)
🟡 Pivot Point (PP): ~₹1,168–₹1,170
This is the key central level — below it bearish bias, above it bullish bias.
🔴 Upside – Resistance Levels
R1: ~₹1,188–₹1,190
R2: ~₹1,202–₹1,205
R3: ~₹1,217–₹1,225+
(Break & hold above these suggests stronger bullish continuation for the day)
🔵 Downside – Support Levels
S1: ~₹1,151–₹1,155
S2: ~₹1,130–₹1,140
S3: ~₹1,113–₹1,120
(Break below these risks faster intraday downside)
📈 Intraday Key Zones to Watch
➡️ Bullish above Pivot (~₹1,168–₹1,170) — Price may look to resistance zones at ₹1,188 → ₹1,202 → ₹1,217.
➡️ Bearish below Pivot — support zones at ₹1,151 → ₹1,130 → ₹1,113 become targets.
📌 Day Trading Bias (1D Frame)
Bullish tilt if price stays above pivot and holds above R1.
Bearish bend if price slips below S1 with follow‑through.
Intraday volatility is high (range breakout strategy often works).
🧠 Quick Notes
These levels are pivot‑based support/resistance commonly used by technical traders.
Markets move with news, volume and momentum — always trade with risk management like stop‑loss near key supports/resistances.
This is not financial advice — verify prices on your live trading platform before taking positions.

Contact Knowledgehub for a detailed consultation: Dm on WhatsApp: [wa.link/a2o0kz]-
Phone No: [+91 93102 26243]-
Email: [tradingviewknowledgehub@gmail.com]---
-- Let’s achieve success together!
Phone No: [+91 93102 26243]-
Email: [tradingviewknowledgehub@gmail.com]---
-- Let’s achieve success together!
関連の投稿
免責事項
これらの情報および投稿は、TradingViewが提供または承認する金融、投資、取引、またはその他の種類の助言もしくは推奨であることを意図したものではなく、またこれらに該当するものでもありません。詳細は利用規約をご覧ください。
Contact Knowledgehub for a detailed consultation: Dm on WhatsApp: [wa.link/a2o0kz]-
Phone No: [+91 93102 26243]-
Email: [tradingviewknowledgehub@gmail.com]---
-- Let’s achieve success together!
Phone No: [+91 93102 26243]-
Email: [tradingviewknowledgehub@gmail.com]---
-- Let’s achieve success together!
関連の投稿
免責事項
これらの情報および投稿は、TradingViewが提供または承認する金融、投資、取引、またはその他の種類の助言もしくは推奨であることを意図したものではなく、またこれらに該当するものでもありません。詳細は利用規約をご覧ください。