
Educational wave study only. Not a buy or sell recommendation.
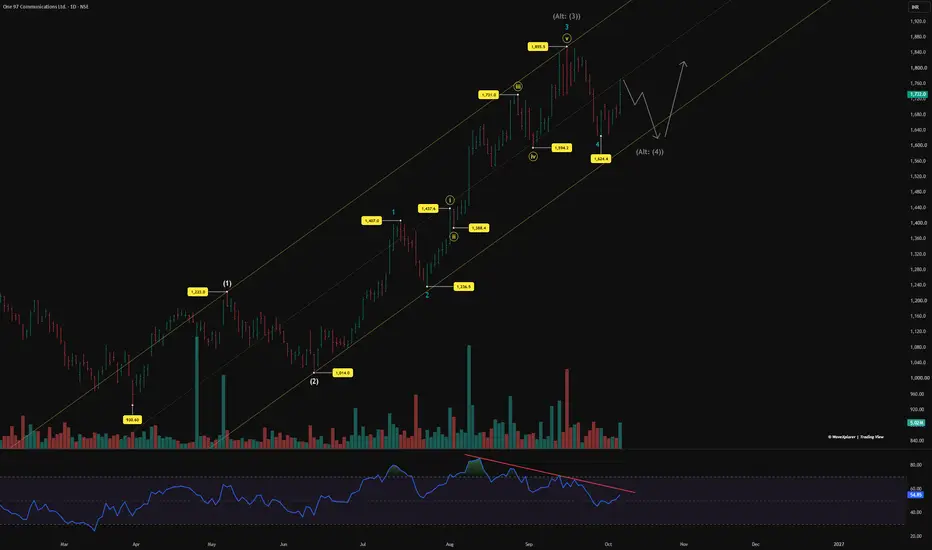
From the March low of 930.6, this stock has moved up in a clean rising channel. The waves, the volume and the RSI all tell the same story.
Wave (1) and (2): Wave (1) went from 930.6 to 1,223 in a choppy, overlapping way. It looks like a leading diagonal. Wave (2) then fell to 1,014, taking back 71.5%. A deep wave 2 is normal after a diagonal.
Wave (3) so far:
Volume and RSI: The highest volume and the highest RSI (about 88) both came in early August, in the middle of wave 3. That's where the strongest part of a third wave usually is. At 1,855.5, price made a new high but RSI made a lower high. This divergence is typical at the end of a fifth wave, here ⓥ of 3. Heavy selling volume near that top confirms it. During wave 4, RSI held above 40, which shows the uptrend is still healthy.
Main view: Wave 5 of (3) may now be starting from 1,624.4. Fibonacci measurements point to the 2,017–2,144 zone for wave (3) to complete.
Alternate view: Wave (3) may already be done at 1,855.5, and wave (4) may still be running. Wave (2) was a sharp, deep fall, so wave (4) is likely to be different: a sideways flat. In this path:
After that, wave (5) could move above 1,855.5, toward 1,917–1,978.
What to watch:
Disclaimer:
I am not a SEBI registered research analyst. This post is shared only for education and learning purposes, based on my personal reading of the chart. It is not a buy or sell recommendation. Please do your own research or speak to a registered advisor before taking any trading decision.
From the March low of 930.6, this stock has moved up in a clean rising channel. The waves, the volume and the RSI all tell the same story.
Wave (1) and (2): Wave (1) went from 930.6 to 1,223 in a choppy, overlapping way. It looks like a leading diagonal. Wave (2) then fell to 1,014, taking back 71.5%. A deep wave 2 is normal after a diagonal.
Wave (3) so far:
- Wave 1 topped at 1,407.
- Wave 2 fell to 1,236.5.
- Wave 3 ran to 1,855.5 in five smaller waves, ⓘ to ⓥ. That's about 1.618 times wave 1.
- Wave 4 ended at 1,624.4, a 38.2% pullback, close to where the smaller wave ⓘⓥ ended (1,594.2).
Volume and RSI: The highest volume and the highest RSI (about 88) both came in early August, in the middle of wave 3. That's where the strongest part of a third wave usually is. At 1,855.5, price made a new high but RSI made a lower high. This divergence is typical at the end of a fifth wave, here ⓥ of 3. Heavy selling volume near that top confirms it. During wave 4, RSI held above 40, which shows the uptrend is still healthy.
Main view: Wave 5 of (3) may now be starting from 1,624.4. Fibonacci measurements point to the 2,017–2,144 zone for wave (3) to complete.
Alternate view: Wave (3) may already be done at 1,855.5, and wave (4) may still be running. Wave (2) was a sharp, deep fall, so wave (4) is likely to be different: a sideways flat. In this path:
- 1,624.4 was wave a.
- The current bounce is wave b.
- Wave c could dip below the lower channel line, toward 1,594–1,543. That's where the smaller wave ⓘⓥ ended, where c equals a, and close to the 38.2% retracement of (3).
After that, wave (5) could move above 1,855.5, toward 1,917–1,978.
What to watch:
- RSI is now close to its falling trendline. If RSI breaks above it while price moves above 1,774, momentum has reset. That's an early sign of wave 5.
- A move above 1,855.5 confirms a new up-leg.
- A drop below 1,624.4 favours the alternate view, with the 1,594–1,543 zone as the area to watch.
- Below 1,407, the main count is wrong.
- Below 1,223, the alternate count is also wrong.
Disclaimer:
I am not a SEBI registered research analyst. This post is shared only for education and learning purposes, based on my personal reading of the chart. It is not a buy or sell recommendation. Please do your own research or speak to a registered advisor before taking any trading decision.

WaveXplorer | Elliott Wave insights
📊 X profile: @veerappa89
📊 X profile: @veerappa89
関連の投稿
免責事項
これらの情報および投稿は、TradingViewが提供または承認する金融、投資、取引、またはその他の種類の助言もしくは推奨であることを意図したものではなく、またこれらに該当するものでもありません。詳細は利用規約をご覧ください。
WaveXplorer | Elliott Wave insights
📊 X profile: @veerappa89
📊 X profile: @veerappa89
関連の投稿
免責事項
これらの情報および投稿は、TradingViewが提供または承認する金融、投資、取引、またはその他の種類の助言もしくは推奨であることを意図したものではなく、またこれらに該当するものでもありません。詳細は利用規約をご覧ください。