
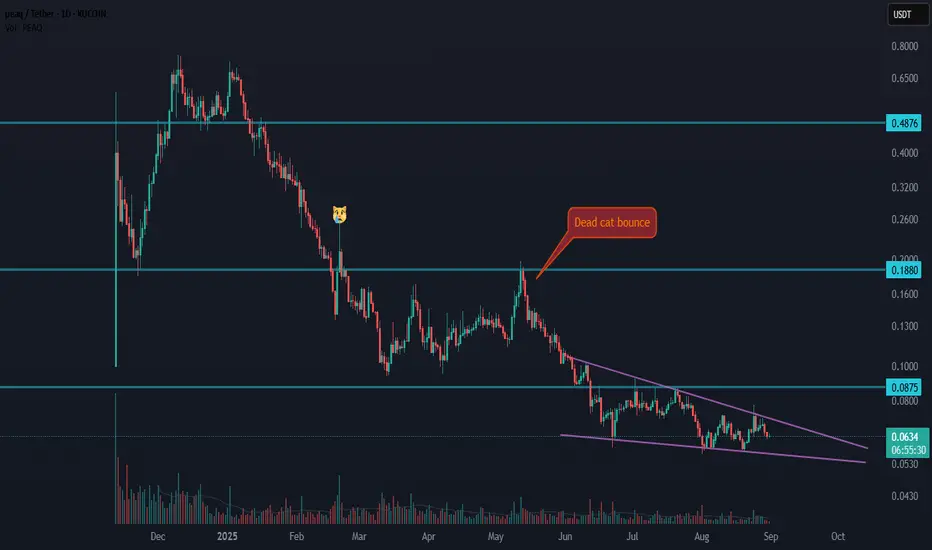
🔄 Update: In the previous setup, price made a dead cat bounce with a fake breakout, and continued its downside move.
Now, the chart has formed a falling wedge, which is considered a strong bullish pattern.
A breakout above the wedge’s resistance could be a solid trigger.
✅ Confirmation of trend reversal will be at 0.0875 in MWC (Medium Wave Cycle) and at 0.1880 in HWC (High Wave Cycle).
⚠️ Please remember: using this analysis requires strict risk management and capital management.
What’s your view on PEAQ? 👇
Now, the chart has formed a falling wedge, which is considered a strong bullish pattern.
A breakout above the wedge’s resistance could be a solid trigger.
✅ Confirmation of trend reversal will be at 0.0875 in MWC (Medium Wave Cycle) and at 0.1880 in HWC (High Wave Cycle).
⚠️ Please remember: using this analysis requires strict risk management and capital management.
What’s your view on
PEAQ? 👇
免責事項
これらの情報および投稿は、TradingViewが提供または承認する金融、投資、取引、またはその他の種類の助言もしくは推奨であることを意図したものではなく、またこれらに該当するものでもありません。詳細は利用規約をご覧ください。
免責事項
これらの情報および投稿は、TradingViewが提供または承認する金融、投資、取引、またはその他の種類の助言もしくは推奨であることを意図したものではなく、またこれらに該当するものでもありません。詳細は利用規約をご覧ください。