
PENDLEUSDT Technical analysis update
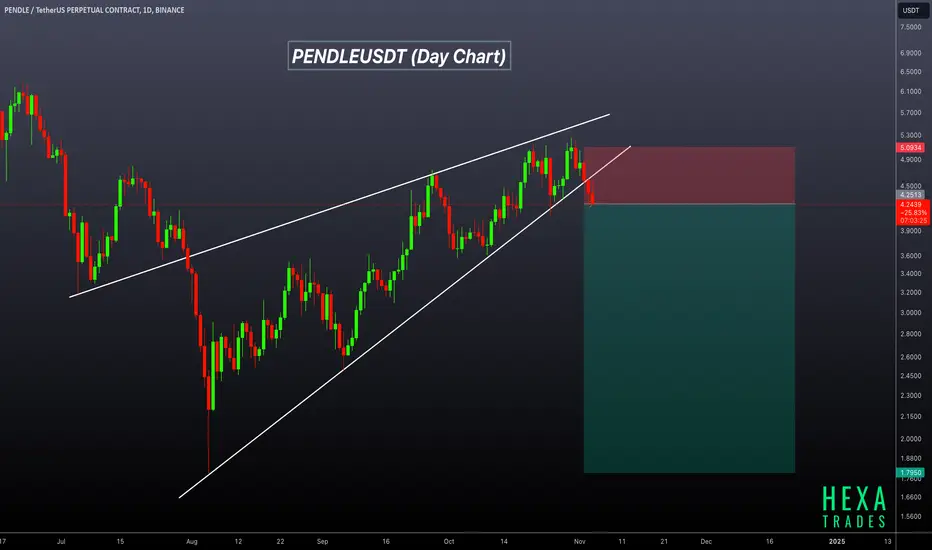
PENDLE has formed a Raising wedge pattern on the daily chart, and the price has recently broken below the wedge's support line in day chart. This breakdown suggests potential bearish momentum in the coming days, with a possible decline toward lower support levels.
PENDLE has formed a Raising wedge pattern on the daily chart, and the price has recently broken below the wedge's support line in day chart. This breakdown suggests potential bearish momentum in the coming days, with a possible decline toward lower support levels.

🚀Telegram : t.me/hexatrades
🌐Website: hexatrades.io/
🗣️Twitter(X): twitter.com/HexaTrades
🌐Website: hexatrades.io/
🗣️Twitter(X): twitter.com/HexaTrades
関連の投稿
免責事項
これらの情報および投稿は、TradingViewが提供または承認する金融、投資、取引、またはその他の種類の助言もしくは推奨であることを意図したものではなく、またこれらに該当するものでもありません。詳細は利用規約をご覧ください。
🚀Telegram : t.me/hexatrades
🌐Website: hexatrades.io/
🗣️Twitter(X): twitter.com/HexaTrades
🌐Website: hexatrades.io/
🗣️Twitter(X): twitter.com/HexaTrades
関連の投稿
免責事項
これらの情報および投稿は、TradingViewが提供または承認する金融、投資、取引、またはその他の種類の助言もしくは推奨であることを意図したものではなく、またこれらに該当するものでもありません。詳細は利用規約をご覧ください。