
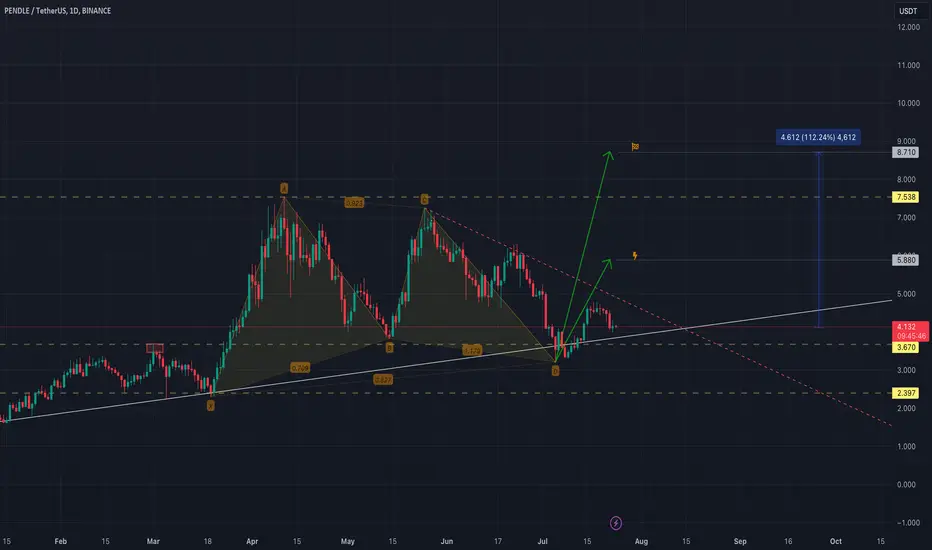
PPENDLE 1D chart;
It accepts the trend line extending from October 2023 to the present as a balance and continues to rise.
We can see an upward movement after the squeeze with the falling trend line.
There is a ratio of 112% between the harmonic structure it has created and the target zone.
It accepts the trend line extending from October 2023 to the present as a balance and continues to rise.
We can see an upward movement after the squeeze with the falling trend line.
There is a ratio of 112% between the harmonic structure it has created and the target zone.

For more you can follow me on X. @UgurTash
免責事項
これらの情報および投稿は、TradingViewが提供または承認する金融、投資、取引、またはその他の種類の助言もしくは推奨であることを意図したものではなく、またこれらに該当するものでもありません。詳細は利用規約をご覧ください。
For more you can follow me on X. @UgurTash
免責事項
これらの情報および投稿は、TradingViewが提供または承認する金融、投資、取引、またはその他の種類の助言もしくは推奨であることを意図したものではなく、またこれらに該当するものでもありません。詳細は利用規約をご覧ください。