Overview:
I am looking at a bullish reversal setup for Pfizer (PFE). The stock has been in a long-term consolidation phase and is now showing signs of a strong trend shift across multiple timeframes.
1. Monthly Timeframe (The Foundation):
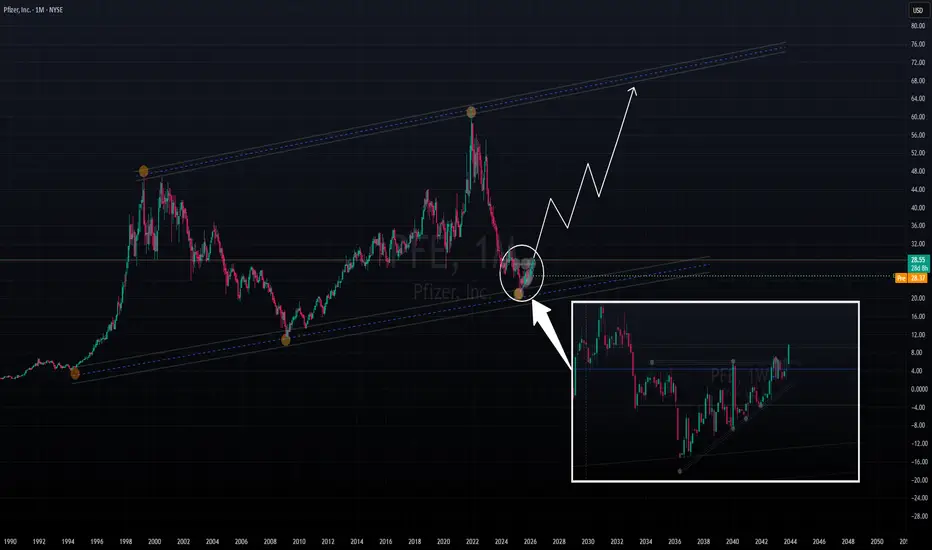
As seen in the image, PFE has arrived at a major long-term support zone. This level has historically acted as a "floor" for the price, where buyers consistently step in. The fact that it is holding this support on the monthly chart gives high confidence for a long-term bottom.
2. Weekly Timeframe (The Trigger):
In the image, we can clearly see a Weekly Trendline Breakout.
The price has broken above a descending resistance line that has been capping gains for months.
The recent weekly candle closed strong above this line, confirming that the momentum is shifting from sellers to buyers.
We are also seeing a series of higher lows forming along a secondary ascending support line.
My Plan/Expectation:
 PFE
PFE
Entry: Current market price or on a slight retest of the breakout level (around $27.50–$28.00).
Target 1: $45.00 (Psychological level and recent swing high).
Target 2: $65.00 (Gap fill area).
Stop Loss: Below the recent weekly swing low or the monthly support zone (around $17.00).
Conclusion:
With the combination of a weekly breakout and a monthly support bounce, the risk-to-reward ratio for a long position looks very attractive here.
I am looking at a bullish reversal setup for Pfizer (PFE). The stock has been in a long-term consolidation phase and is now showing signs of a strong trend shift across multiple timeframes.
1. Monthly Timeframe (The Foundation):
As seen in the image, PFE has arrived at a major long-term support zone. This level has historically acted as a "floor" for the price, where buyers consistently step in. The fact that it is holding this support on the monthly chart gives high confidence for a long-term bottom.
2. Weekly Timeframe (The Trigger):
In the image, we can clearly see a Weekly Trendline Breakout.
The price has broken above a descending resistance line that has been capping gains for months.
The recent weekly candle closed strong above this line, confirming that the momentum is shifting from sellers to buyers.
We are also seeing a series of higher lows forming along a secondary ascending support line.
My Plan/Expectation:
PFE Entry: Current market price or on a slight retest of the breakout level (around $27.50–$28.00).
Target 1: $45.00 (Psychological level and recent swing high).
Target 2: $65.00 (Gap fill area).
Stop Loss: Below the recent weekly swing low or the monthly support zone (around $17.00).
Conclusion:
With the combination of a weekly breakout and a monthly support bounce, the risk-to-reward ratio for a long position looks very attractive here.
トレード稼働中

関連の投稿
免責事項
これらの情報および投稿は、TradingViewが提供または承認する金融、投資、取引、またはその他の種類の助言もしくは推奨であることを意図したものではなく、またこれらに該当するものでもありません。詳細は利用規約をご覧ください。
免責事項
これらの情報および投稿は、TradingViewが提供または承認する金融、投資、取引、またはその他の種類の助言もしくは推奨であることを意図したものではなく、またこれらに該当するものでもありません。詳細は利用規約をご覧ください。