PFIE Analysis
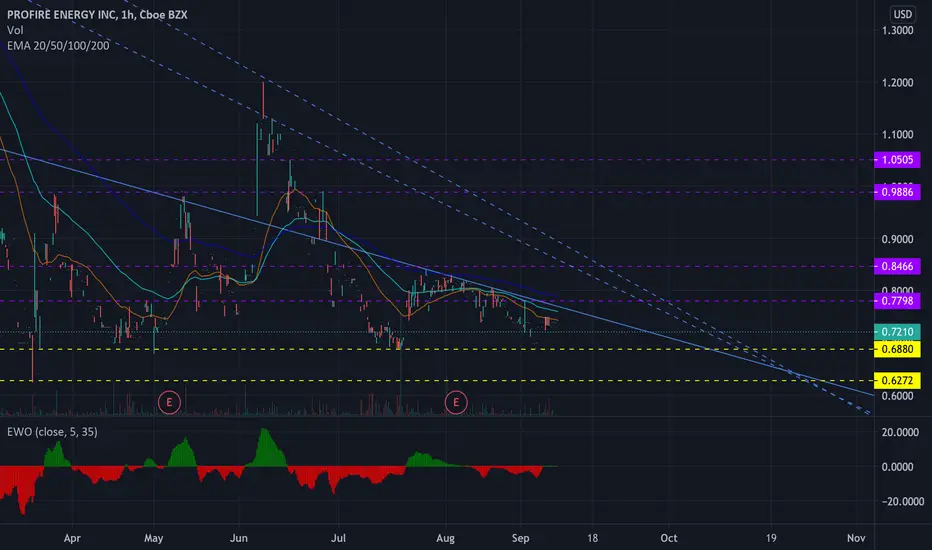
Recently, PFIE has been trading under its 20 EMA, indicating weakness. However, if PFIE can climb above .78, it could see higher highs, and a break above the current resistance represented by the full blue line could bring even higher levels towards to the purple resistance levels. However, PFIE has been holding .688 level very well -- a bounce off this level is imminent, but if it trend below this line, there's still a gap to fill down to .62.

免責事項
これらの情報および投稿は、TradingViewが提供または承認する金融、投資、取引、またはその他の種類の助言もしくは推奨であることを意図したものではなく、またこれらに該当するものでもありません。詳細は利用規約をご覧ください。
免責事項
これらの情報および投稿は、TradingViewが提供または承認する金融、投資、取引、またはその他の種類の助言もしくは推奨であることを意図したものではなく、またこれらに該当するものでもありません。詳細は利用規約をご覧ください。