ロング
Phoenix Global Consolidation Plus Signals Explained
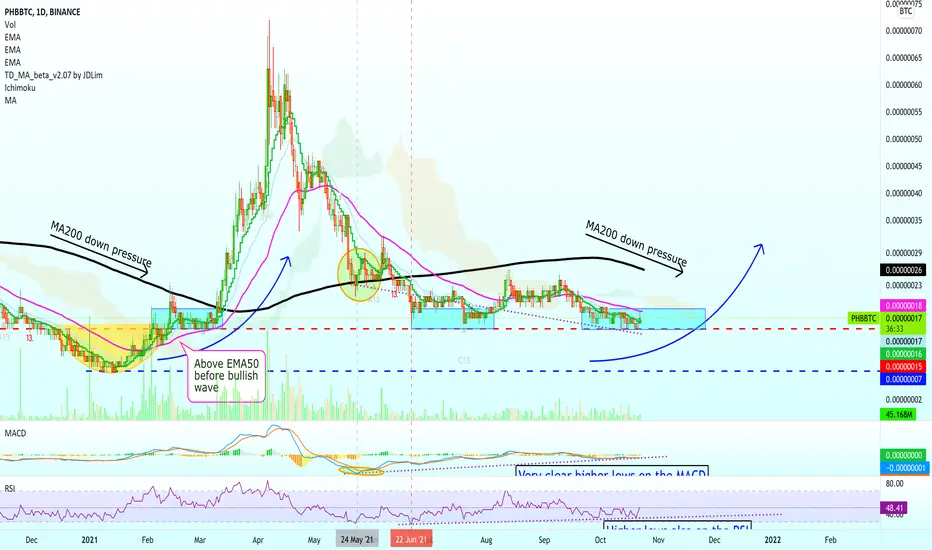
Here we have Phoenix Global (PHBBTC) which we have been waiting for a while...
This pair has been consolidating since June when the first low was hit after April's peak.
15 Satoshi continues to be our baseline and so far we are looking good as prices remain above this level.
The reason I am writing about this pair today is that I saw a challenge of EMA50 (18 satoshi/ 0.00000018) which is the most important level to look at short-term pertaining to strong bullish growth.
We also see EMA10/21 being challenged/conquered.
Now, here is the signal that gives away the fact that the consolidation period is reaching its end.
Notice PHBBTC from May printing lower lows.
Now I will show you the RSI and MACD, both printing higher lows.
MACD:
RSI:
That's a bullish divergence.
When combined with the signals we read above it makes for a strong case that it can only take a few weeks before the next bullish run.
The time period can vary wildly, we do not worry about it, we simply buy and we hold.
Patience is the key.
That's my strategy.
Thanks a lot for your continued support.
Namaste.
P.S. There can always be one last strong checkout before the bullish wave becomes 100% obvious. Sometimes it is a long wick or it can take a week.
We use manual stop-loss and do not worry about this.
This pair has been consolidating since June when the first low was hit after April's peak.
15 Satoshi continues to be our baseline and so far we are looking good as prices remain above this level.
The reason I am writing about this pair today is that I saw a challenge of EMA50 (18 satoshi/ 0.00000018) which is the most important level to look at short-term pertaining to strong bullish growth.
We also see EMA10/21 being challenged/conquered.
Now, here is the signal that gives away the fact that the consolidation period is reaching its end.
Notice PHBBTC from May printing lower lows.
Now I will show you the RSI and MACD, both printing higher lows.
MACD:
RSI:
That's a bullish divergence.
When combined with the signals we read above it makes for a strong case that it can only take a few weeks before the next bullish run.
The time period can vary wildly, we do not worry about it, we simply buy and we hold.
Patience is the key.
That's my strategy.
Thanks a lot for your continued support.
Namaste.
P.S. There can always be one last strong checkout before the bullish wave becomes 100% obvious. Sometimes it is a long wick or it can take a week.
We use manual stop-loss and do not worry about this.
ノート
This one is already moving...
🔥 Get the FULL (4-in-1) PREMIUM PACKAGE 👇
t.me/lamatrades/4 (Since 2017)
✅ FREE PREMIUM trade-numbers (4-10X) 👇
t.me/masteranandatrades/9043
🚨 TOP Results May 2026 👇
t.me/masteranandatrades/8778
t.me/lamatrades/4 (Since 2017)
✅ FREE PREMIUM trade-numbers (4-10X) 👇
t.me/masteranandatrades/9043
🚨 TOP Results May 2026 👇
t.me/masteranandatrades/8778
関連の投稿
免責事項
これらの情報および投稿は、TradingViewが提供または承認する金融、投資、取引、またはその他の種類の助言もしくは推奨であることを意図したものではなく、またこれらに該当するものでもありません。詳細は利用規約をご覧ください。
🔥 Get the FULL (4-in-1) PREMIUM PACKAGE 👇
t.me/lamatrades/4 (Since 2017)
✅ FREE PREMIUM trade-numbers (4-10X) 👇
t.me/masteranandatrades/9043
🚨 TOP Results May 2026 👇
t.me/masteranandatrades/8778
t.me/lamatrades/4 (Since 2017)
✅ FREE PREMIUM trade-numbers (4-10X) 👇
t.me/masteranandatrades/9043
🚨 TOP Results May 2026 👇
t.me/masteranandatrades/8778
関連の投稿
免責事項
これらの情報および投稿は、TradingViewが提供または承認する金融、投資、取引、またはその他の種類の助言もしくは推奨であることを意図したものではなく、またこれらに該当するものでもありません。詳細は利用規約をご覧ください。