
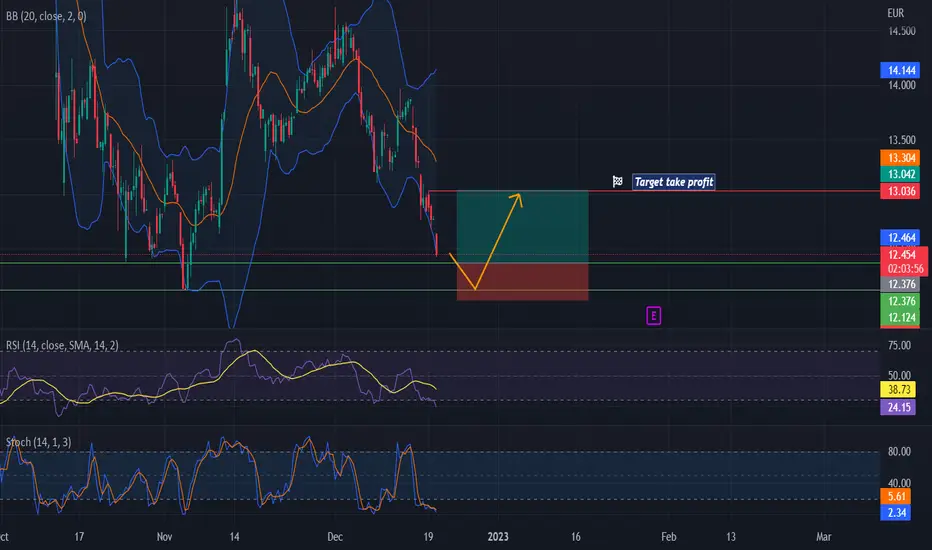
On the Philips chart (PHIA - 4h timeframe), We can see the price is currently oversold. The price is approaching a support area and is probably going to bounce off. Enter and leave the trade at the level defined on the chart.
The three indicators used are Bollinger Bands, RSI, and Stochastics. All these three indicators are confirming the oversold condition.
See all further details on the chart.
Good luck!
The three indicators used are Bollinger Bands, RSI, and Stochastics. All these three indicators are confirming the oversold condition.
See all further details on the chart.
Good luck!
トレード終了: 利益確定目標に到達
target reached and overshooted.
💥 Free signals and ideas ➡ t.me/vfinvestment
関連の投稿
免責事項
これらの情報および投稿は、TradingViewが提供または承認する金融、投資、取引、またはその他の種類の助言もしくは推奨であることを意図したものではなく、またこれらに該当するものでもありません。詳細は利用規約をご覧ください。
💥 Free signals and ideas ➡ t.me/vfinvestment
関連の投稿
免責事項
これらの情報および投稿は、TradingViewが提供または承認する金融、投資、取引、またはその他の種類の助言もしくは推奨であることを意図したものではなく、またこれらに該当するものでもありません。詳細は利用規約をご覧ください。