
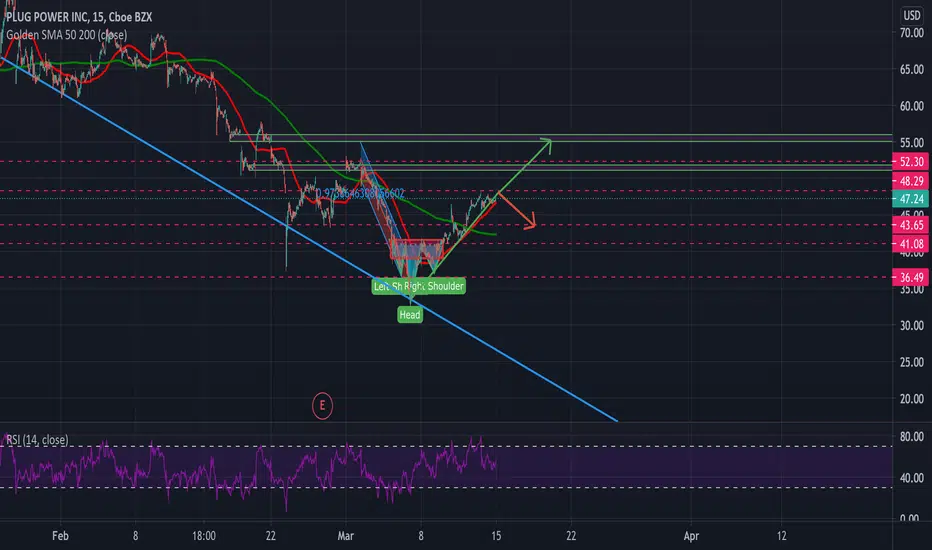
After a long regression, PLUG seems to have found its bottom after falling 40% from its 52-week high ending the regression with an inverse head and shoulders. Bollinger Bands are squeezing on its 6-month chart along with what looks like an impending MACD cross. PLUG needs to break the FIB resistance levels charted which seems relatively likely as long as the broader market doesn't experience a pullback as 10-year treasury yields have been fluctuating. PT1- $51.81, PT2- $56.19
Has strong top resistance at the $69-70 level
Has strong top resistance at the $69-70 level

免責事項
これらの情報および投稿は、TradingViewが提供または承認する金融、投資、取引、またはその他の種類の助言もしくは推奨であることを意図したものではなく、またこれらに該当するものでもありません。詳細は利用規約をご覧ください。
免責事項
これらの情報および投稿は、TradingViewが提供または承認する金融、投資、取引、またはその他の種類の助言もしくは推奨であることを意図したものではなく、またこれらに該当するものでもありません。詳細は利用規約をご覧ください。