
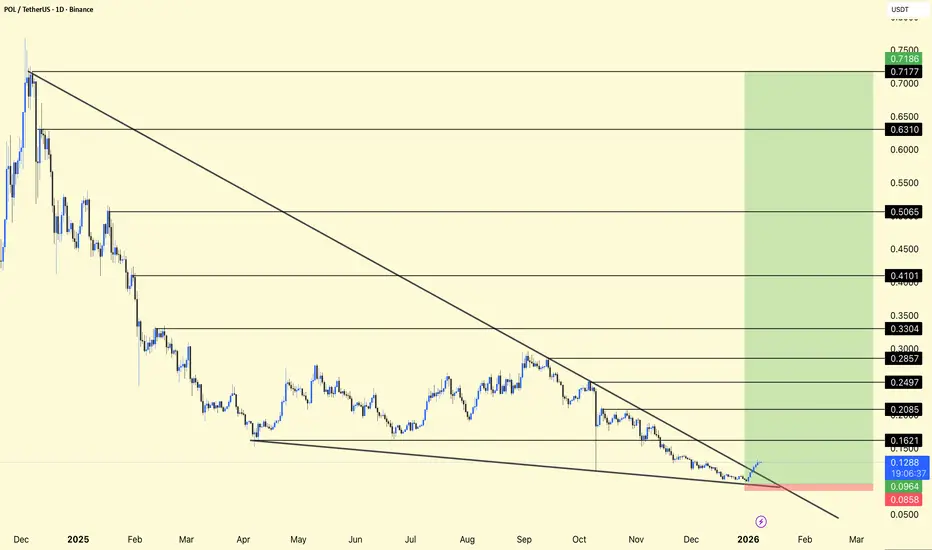
POL/USDT – 1D Chart Update | Long Trade Setup
Long-term downtrend still intact
Price holding near major support zone
Possible trendline base reaction visible
📍 Entry Zone
0.095 – 0.105 USDT (Accumulation area)
🛑 Stop Loss
Below 0.085 USDT (Daily close basis)
🎯 Targets
T1: 0.162
T2: 0.208
T3: 0.285
T4: 0.410
T5: 0.506
T6: 0.631
T7: 0.717
Price at historical demand + trendline support
High risk–reward setup
Expectation of trendline breakout on a higher timeframe
This is a high-risk, high-reward setup
Use proper position sizing and strict SL
Short-term volatility expected
Mid-to-long term bounce possible if support holds
Not financial advice. Trade with discipline.
Long-term downtrend still intact
Price holding near major support zone
Possible trendline base reaction visible
📍 Entry Zone
0.095 – 0.105 USDT (Accumulation area)
🛑 Stop Loss
Below 0.085 USDT (Daily close basis)
🎯 Targets
T1: 0.162
T2: 0.208
T3: 0.285
T4: 0.410
T5: 0.506
T6: 0.631
T7: 0.717
Price at historical demand + trendline support
High risk–reward setup
Expectation of trendline breakout on a higher timeframe
This is a high-risk, high-reward setup
Use proper position sizing and strict SL
Short-term volatility expected
Mid-to-long term bounce possible if support holds
Not financial advice. Trade with discipline.

関連の投稿
免責事項
これらの情報および投稿は、TradingViewが提供または承認する金融、投資、取引、またはその他の種類の助言もしくは推奨であることを意図したものではなく、またこれらに該当するものでもありません。詳細は利用規約をご覧ください。
関連の投稿
免責事項
これらの情報および投稿は、TradingViewが提供または承認する金融、投資、取引、またはその他の種類の助言もしくは推奨であることを意図したものではなく、またこれらに該当するものでもありません。詳細は利用規約をご覧ください。