
And why the stock market is about to melt up.
The majority of market participants are bearish. From hedge fund managers to popular media outlets, everyone is calling for the crash of a lifetime.
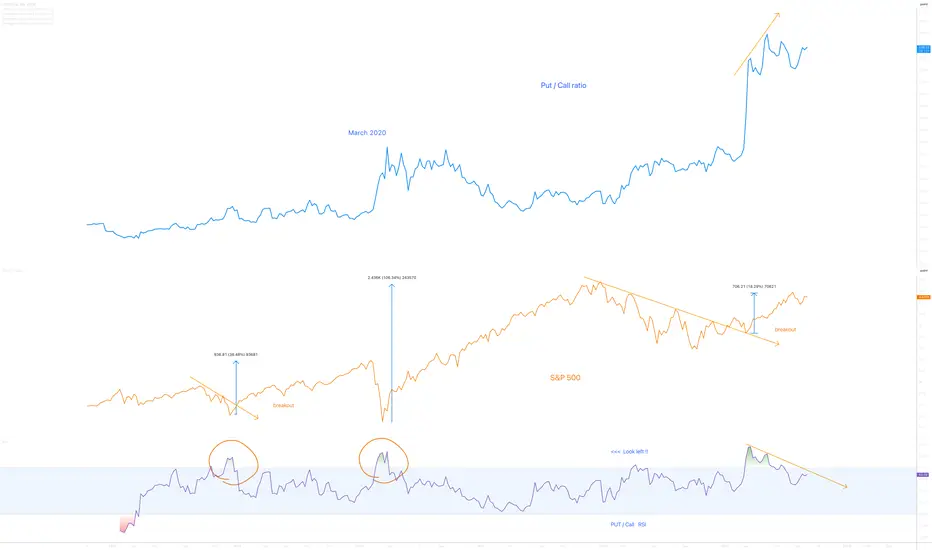
The above weekly chart tells a fascinating story. Could talk about it for hours. There are three line charts here. From top to bottom,
1) The Put / Call ratio. This is the number of Put contracts open. i.e. folks who are ‘short’ on the stock market. That includes Dr Michael Burry.
2) The S&P 500 index
3) The Put / Call Relative Strength Index
Never in history have so many market participants been this bearish as is shown on the Put/Call chart (1). Am forever writing in the ideas I publish, 90% of market participants will lose money. This chart is screaming why the majority are about to be caught out..
Breaking it down..
A) Bearish divergence between the Put/Call ratio (1) and RSI (3) following an extreme overbought condition. Look left. Not only is the divergence confirmed lower highs are printing.
B) Price action resistance breakouts.
C) The stock market has ripped higher when the Put/Call ratio corrects. I know, this time is different ;-)
Is it possible this is meaningless gibberish flying in the face of the economic fundamentals?
For sure.
Is it probable the market rips to new all time highs?
Yes.
Ww
The majority of market participants are bearish. From hedge fund managers to popular media outlets, everyone is calling for the crash of a lifetime.
The above weekly chart tells a fascinating story. Could talk about it for hours. There are three line charts here. From top to bottom,
1) The Put / Call ratio. This is the number of Put contracts open. i.e. folks who are ‘short’ on the stock market. That includes Dr Michael Burry.
2) The S&P 500 index
3) The Put / Call Relative Strength Index
Never in history have so many market participants been this bearish as is shown on the Put/Call chart (1). Am forever writing in the ideas I publish, 90% of market participants will lose money. This chart is screaming why the majority are about to be caught out..
Breaking it down..
A) Bearish divergence between the Put/Call ratio (1) and RSI (3) following an extreme overbought condition. Look left. Not only is the divergence confirmed lower highs are printing.
B) Price action resistance breakouts.
C) The stock market has ripped higher when the Put/Call ratio corrects. I know, this time is different ;-)
Is it possible this is meaningless gibberish flying in the face of the economic fundamentals?
For sure.
Is it probable the market rips to new all time highs?
Yes.
Ww
ノート
Put contracts size shrinking, stock market moving up. Coincidence?トレード稼働中
Have a look at the 2-month Put/Call ratio. Short sellers are now trying to open new Put contracts as markets test previous all time highs.This is a grand lesson on why the masses lose their shirts.

関連の投稿
免責事項
これらの情報および投稿は、TradingViewが提供または承認する金融、投資、取引、またはその他の種類の助言もしくは推奨であることを意図したものではなく、またこれらに該当するものでもありません。詳細は利用規約をご覧ください。
関連の投稿
免責事項
これらの情報および投稿は、TradingViewが提供または承認する金融、投資、取引、またはその他の種類の助言もしくは推奨であることを意図したものではなく、またこれらに該当するものでもありません。詳細は利用規約をご覧ください。