
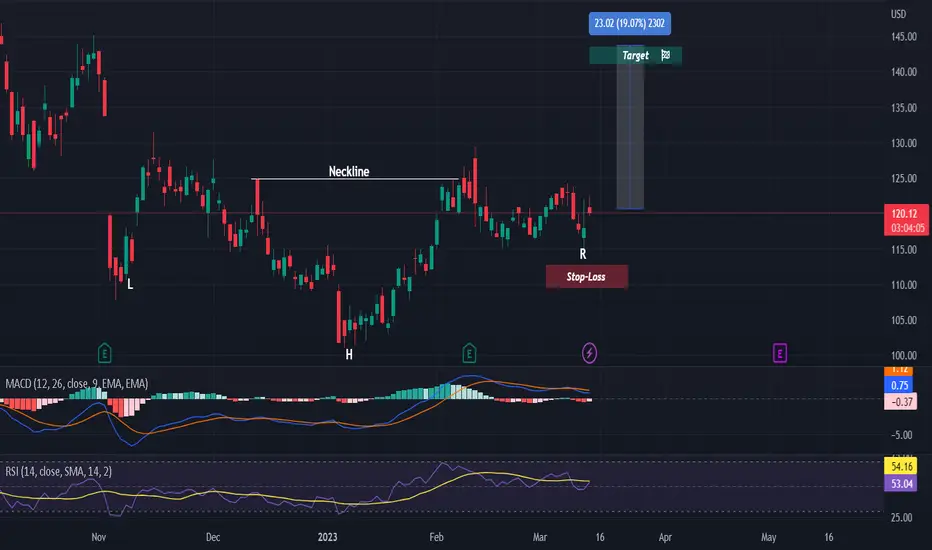
On the chart, we can see an inverse head and shoulders, which is a strong bullish pattern.
Both MACD and RSI are indicating bullish crossings.
We will now wait for a breakout of the neckline, to take our entry.
More details are shown on the chart.
Good luck! 🚀
Both MACD and RSI are indicating bullish crossings.
We will now wait for a breakout of the neckline, to take our entry.
More details are shown on the chart.
Good luck! 🚀

💥 Free signals and ideas ➡ t.me/vfinvestment
関連の投稿
免責事項
これらの情報および投稿は、TradingViewが提供または承認する金融、投資、取引、またはその他の種類の助言もしくは推奨であることを意図したものではなく、またこれらに該当するものでもありません。詳細は利用規約をご覧ください。
💥 Free signals and ideas ➡ t.me/vfinvestment
関連の投稿
免責事項
これらの情報および投稿は、TradingViewが提供または承認する金融、投資、取引、またはその他の種類の助言もしくは推奨であることを意図したものではなく、またこれらに該当するものでもありません。詳細は利用規約をご覧ください。