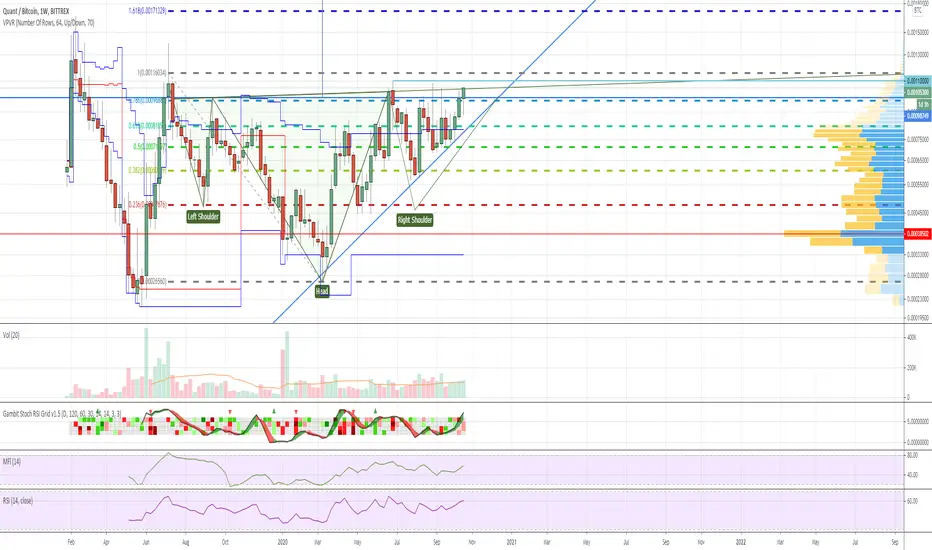
Ascending tirangle + potential head and shoulders pattern.
ノート
Looks good on daily although a lot of macro uncertaintyノート
Fake break down on lower time frame (triangle) and bounce from ascending triangle support:ノート
We are getting some decent volume and spikes at the support area:ノート
QNT broke down which I think is a fake move. According to very high volume, I would guess that whales were accumulating QNT.
免責事項
これらの情報および投稿は、TradingViewが提供または承認する金融、投資、取引、またはその他の種類の助言もしくは推奨であることを意図したものではなく、またこれらに該当するものでもありません。詳細は利用規約をご覧ください。
免責事項
これらの情報および投稿は、TradingViewが提供または承認する金融、投資、取引、またはその他の種類の助言もしくは推奨であることを意図したものではなく、またこれらに該当するものでもありません。詳細は利用規約をご覧ください。