
“It has gone up three times. The next one has to be down.”
That is a tempting reason to fade a move. Before acting on it, ask how often that exact condition has changed the odds on this chart.
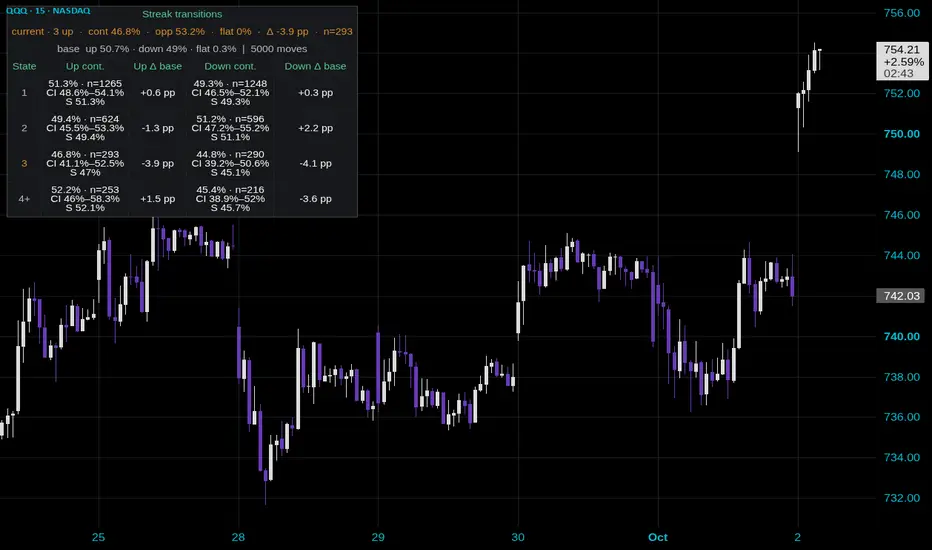
In this QQQ 15-minute snapshot, the three-up row in Streak Statistics contains 293 resolved observations. The next close continued higher 46.8% of the time. The overall up-close baseline is 50.7%, so the difference is minus 3.9 percentage points.
The displayed 95% interval runs from 41.1% to 52.5%, which includes that baseline. This sample gives me little reason to treat “three in a row” as a decisive reversal argument. It also gives me no reason to assume the run must continue.
The important detail is the comparison group. A percentage on its own cannot tell you whether the streak added much information. Compare it with the ordinary rate, then check the number of observations and the uncertainty around it.
One easy counting mistake: this tool compares each close with the previous close. White and purple candles compare close with open. A purple candle can still close above the previous candle's close. Count the measurement the table actually uses.
For a countertrend idea, I would still need a price-based trigger and a clear point where the idea fails. “It is due” supplies neither. The table's opposite-direction share also says nothing about the size of the move or whether a trade survives costs and exits.
This view uses 5,000 observed moves and a calendar-day reset in the exchange timezone. The compact 4+ row pools longer streaks; row 3 remains exact. Read confirmed closes, and keep those settings consistent when comparing samples.
That is a tempting reason to fade a move. Before acting on it, ask how often that exact condition has changed the odds on this chart.
In this QQQ 15-minute snapshot, the three-up row in Streak Statistics contains 293 resolved observations. The next close continued higher 46.8% of the time. The overall up-close baseline is 50.7%, so the difference is minus 3.9 percentage points.
The displayed 95% interval runs from 41.1% to 52.5%, which includes that baseline. This sample gives me little reason to treat “three in a row” as a decisive reversal argument. It also gives me no reason to assume the run must continue.
The important detail is the comparison group. A percentage on its own cannot tell you whether the streak added much information. Compare it with the ordinary rate, then check the number of observations and the uncertainty around it.
One easy counting mistake: this tool compares each close with the previous close. White and purple candles compare close with open. A purple candle can still close above the previous candle's close. Count the measurement the table actually uses.
For a countertrend idea, I would still need a price-based trigger and a clear point where the idea fails. “It is due” supplies neither. The table's opposite-direction share also says nothing about the size of the move or whether a trade survives costs and exits.
This view uses 5,000 observed moves and a calendar-day reset in the exchange timezone. The compact 4+ row pools longer streaks; row 3 remains exact. Read confirmed closes, and keep those settings consistent when comparing samples.

免責事項
これらの情報および投稿は、TradingViewが提供または承認する金融、投資、取引、またはその他の種類の助言もしくは推奨であることを意図したものではなく、またこれらに該当するものでもありません。詳細は利用規約をご覧ください。
免責事項
これらの情報および投稿は、TradingViewが提供または承認する金融、投資、取引、またはその他の種類の助言もしくは推奨であることを意図したものではなく、またこれらに該当するものでもありません。詳細は利用規約をご覧ください。