
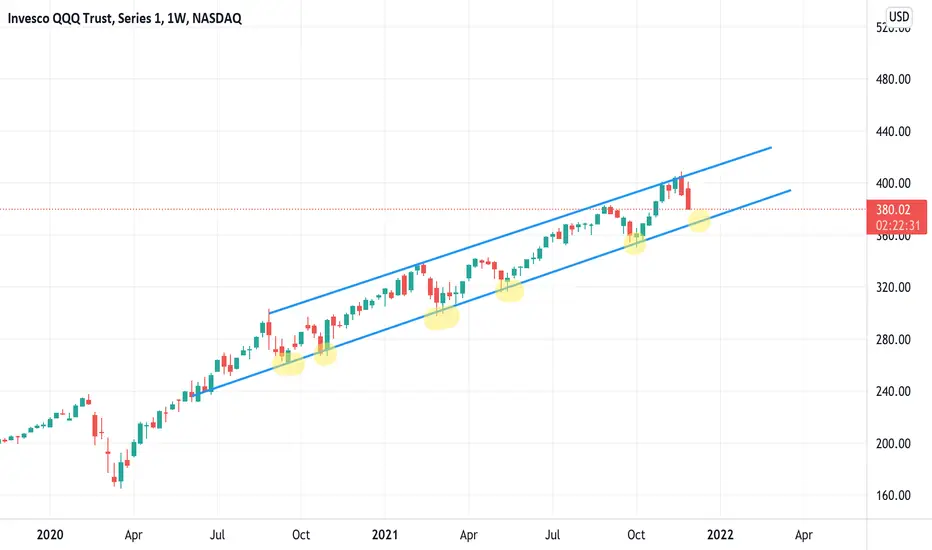
The Nasdaq100 has been strong, and its trend is still bullish; however, short term we might see some more selling to test the bottom of the channel.
It's a great exercise on any chart to use maybe 1 or 2 moving averages as use a weekly candlestick chart to see the bigger picture.
It's a great exercise on any chart to use maybe 1 or 2 moving averages as use a weekly candlestick chart to see the bigger picture.

免責事項
これらの情報および投稿は、TradingViewが提供または承認する金融、投資、取引、またはその他の種類の助言もしくは推奨であることを意図したものではなく、またこれらに該当するものでもありません。詳細は利用規約をご覧ください。
免責事項
これらの情報および投稿は、TradingViewが提供または承認する金融、投資、取引、またはその他の種類の助言もしくは推奨であることを意図したものではなく、またこれらに該当するものでもありません。詳細は利用規約をご覧ください。