
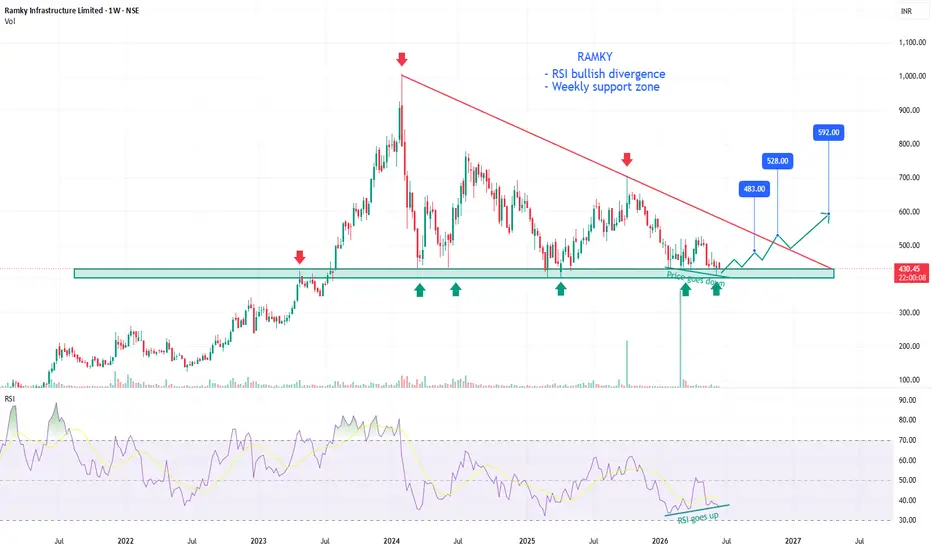
The 400–430 zone has acted as strong support multiple times over the past three years. Each test has been followed by a recovery — buyers have consistently defended this level.
What adds conviction now is the RSI bullish divergence on the weekly. Price made lower lows, but RSI didn't follow. it made higher lows instead. Selling pressure is weakening while price sits on a proven support floor. That's a meaningful combination.
Trade plan
Entry: 415–430
SL: 395 (weekly close below)
T1: 483 · T2: 528 · T3: 592
R:R → 1:3 minimum
Setup remains valid as long as ₹395 holds.
For educational purposes only.
What adds conviction now is the RSI bullish divergence on the weekly. Price made lower lows, but RSI didn't follow. it made higher lows instead. Selling pressure is weakening while price sits on a proven support floor. That's a meaningful combination.
Trade plan
Entry: 415–430
SL: 395 (weekly close below)
T1: 483 · T2: 528 · T3: 592
R:R → 1:3 minimum
Setup remains valid as long as ₹395 holds.
For educational purposes only.

免責事項
これらの情報および投稿は、TradingViewが提供または承認する金融、投資、取引、またはその他の種類の助言もしくは推奨であることを意図したものではなく、またこれらに該当するものでもありません。詳細は利用規約をご覧ください。
免責事項
これらの情報および投稿は、TradingViewが提供または承認する金融、投資、取引、またはその他の種類の助言もしくは推奨であることを意図したものではなく、またこれらに該当するものでもありません。詳細は利用規約をご覧ください。