RBS – Poised for bearish break
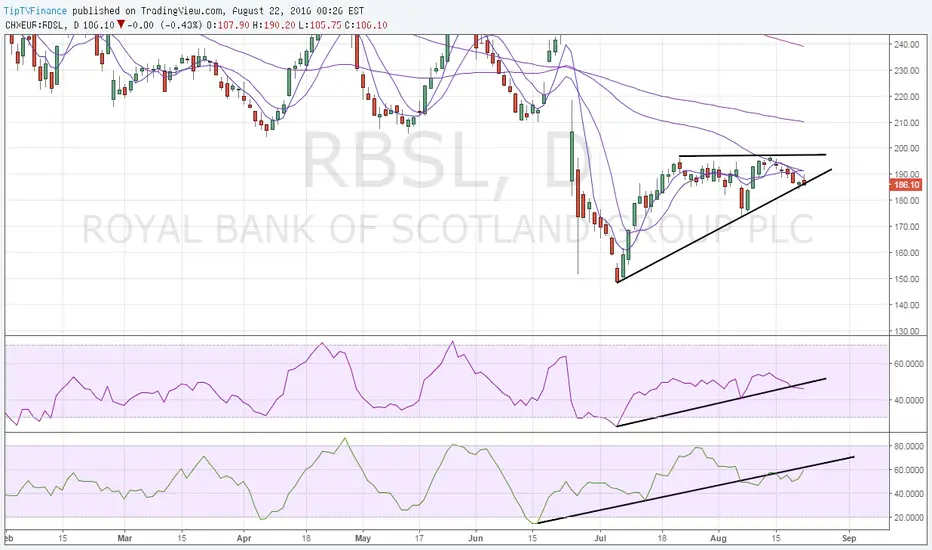
Daily chart pattern – Bearish breakout from rising wedge
Failure to hold above 50-DMA if followed by bearish break from rising wedge on day end closing basis coupled with daily RSI breaching rising trend line and falling money flow index would signal a sell-off to 173.80 (Aug 5 low).
On the higher side, only day end close above 50-DMA would signal bearish invalidation.
Failure to hold above 50-DMA if followed by bearish break from rising wedge on day end closing basis coupled with daily RSI breaching rising trend line and falling money flow index would signal a sell-off to 173.80 (Aug 5 low).
On the higher side, only day end close above 50-DMA would signal bearish invalidation.

関連の投稿
免責事項
これらの情報および投稿は、TradingViewが提供または承認する金融、投資、取引、またはその他の種類の助言もしくは推奨であることを意図したものではなく、またこれらに該当するものでもありません。詳細は利用規約をご覧ください。
免責事項
これらの情報および投稿は、TradingViewが提供または承認する金融、投資、取引、またはその他の種類の助言もしくは推奨であることを意図したものではなく、またこれらに該当するものでもありません。詳細は利用規約をご覧ください。