
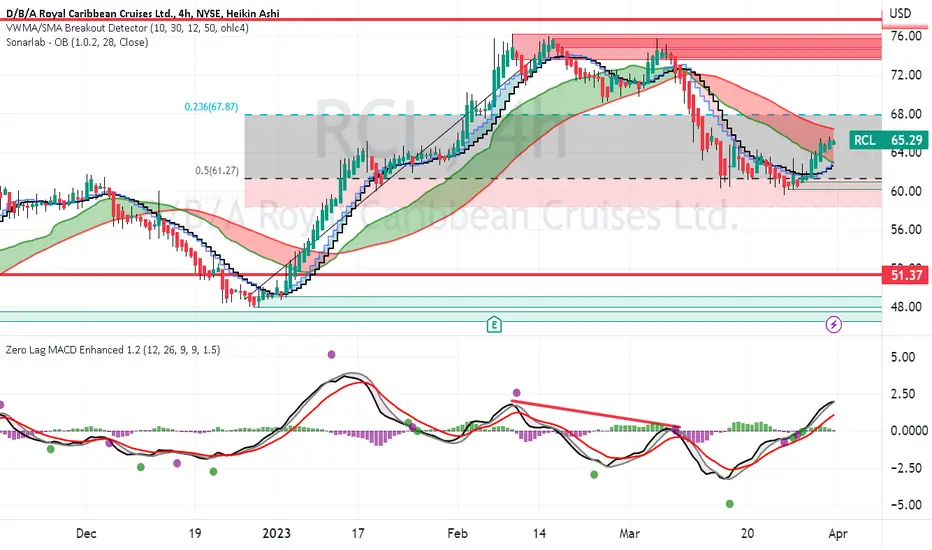
RCL had a triple top this past winder then downtrend to the Fib 0.5 level.
On the chart, the tripe top is also resistance with sell orders blocks by the indicator.
The fib 0.5 level $ 61.27 is the support. A stop loss could be placed immediately
below that. The zero-lag MACD shows nearish divergence while the price rose into
the triple. That divergence has not yet recurred. I see this as a swing long while
RCL seeks to recover its customer base and rebuild its revenue stream.
On the chart, the tripe top is also resistance with sell orders blocks by the indicator.
The fib 0.5 level $ 61.27 is the support. A stop loss could be placed immediately
below that. The zero-lag MACD shows nearish divergence while the price rose into
the triple. That divergence has not yet recurred. I see this as a swing long while
RCL seeks to recover its customer base and rebuild its revenue stream.

免責事項
これらの情報および投稿は、TradingViewが提供または承認する金融、投資、取引、またはその他の種類の助言もしくは推奨であることを意図したものではなく、またこれらに該当するものでもありません。詳細は利用規約をご覧ください。
免責事項
これらの情報および投稿は、TradingViewが提供または承認する金融、投資、取引、またはその他の種類の助言もしくは推奨であることを意図したものではなく、またこれらに該当するものでもありません。詳細は利用規約をご覧ください。