
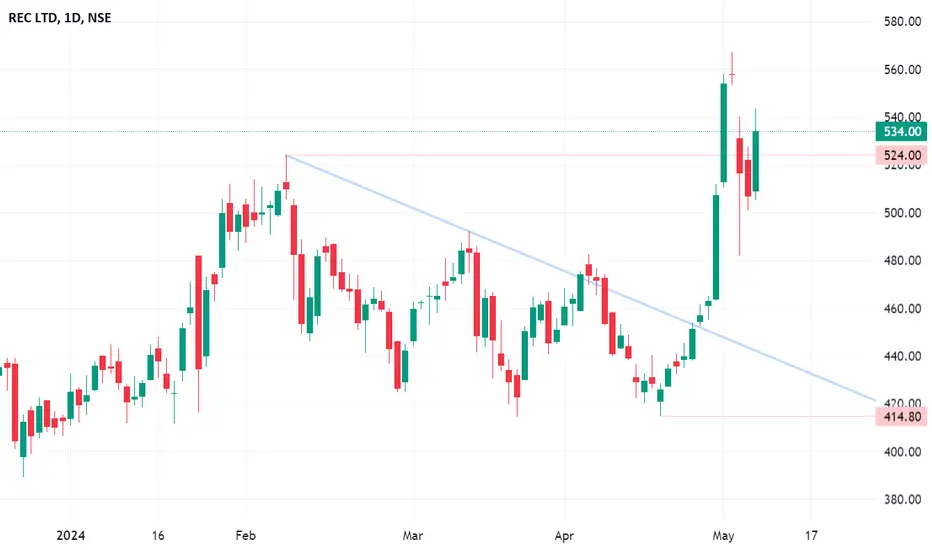
There are 2 points to be noticed in the daily chart of REC Ltd
1. There was a breakout from the downtrend on 26th April
2. The resistance was broken on 2nd May but then we saw a selling pressure in the stock but the candle made today is a decent bullish candle and this could be a breakout as well.
Can buy for targets of 570 & 590.
Educational purpose only
1. There was a breakout from the downtrend on 26th April
2. The resistance was broken on 2nd May but then we saw a selling pressure in the stock but the candle made today is a decent bullish candle and this could be a breakout as well.
Can buy for targets of 570 & 590.
Educational purpose only

免責事項
これらの情報および投稿は、TradingViewが提供または承認する金融、投資、取引、またはその他の種類の助言もしくは推奨であることを意図したものではなく、またこれらに該当するものでもありません。詳細は利用規約をご覧ください。
免責事項
これらの情報および投稿は、TradingViewが提供または承認する金融、投資、取引、またはその他の種類の助言もしくは推奨であることを意図したものではなく、またこれらに該当するものでもありません。詳細は利用規約をご覧ください。