
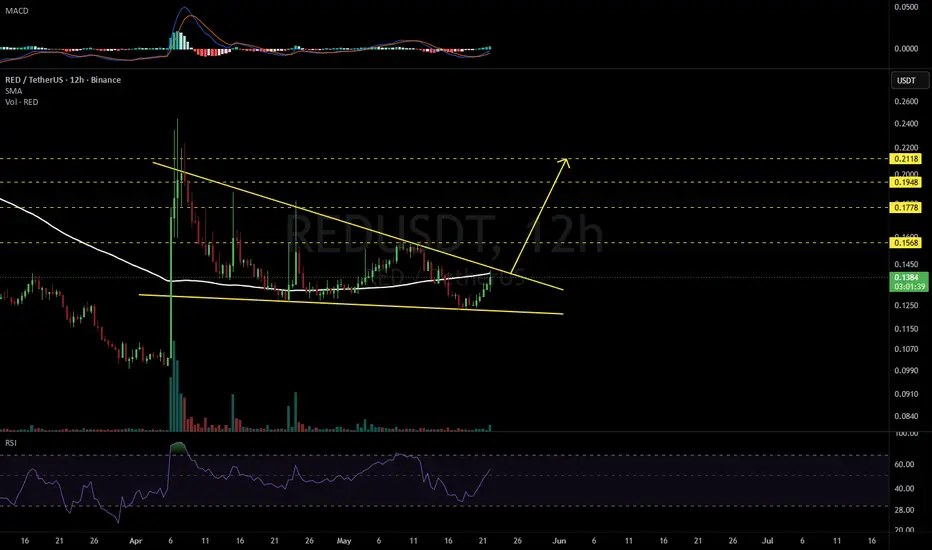
#RED is moving inside a falling wedge pattern on the 12H timeframe. Volume is increasing, while RSI and MACD are also showing signs of potential bullish momentum. In case of a breakout above the wedge resistance and the 12H SMA100, the potential upside targets are:
🎯 $0.1568
🎯 $0.1778
🎯 $0.1948
🎯 $0.2118
⚠️ Always remember to use a tight stop-loss and maintain proper risk management.
🎯 $0.1568
🎯 $0.1778
🎯 $0.1948
🎯 $0.2118
⚠️ Always remember to use a tight stop-loss and maintain proper risk management.

免責事項
これらの情報および投稿は、TradingViewが提供または承認する金融、投資、取引、またはその他の種類の助言もしくは推奨であることを意図したものではなく、またこれらに該当するものでもありません。詳細は利用規約をご覧ください。
免責事項
これらの情報および投稿は、TradingViewが提供または承認する金融、投資、取引、またはその他の種類の助言もしくは推奨であることを意図したものではなく、またこれらに該当するものでもありません。詳細は利用規約をご覧ください。