ロング
REN Ready For A 130% Run?
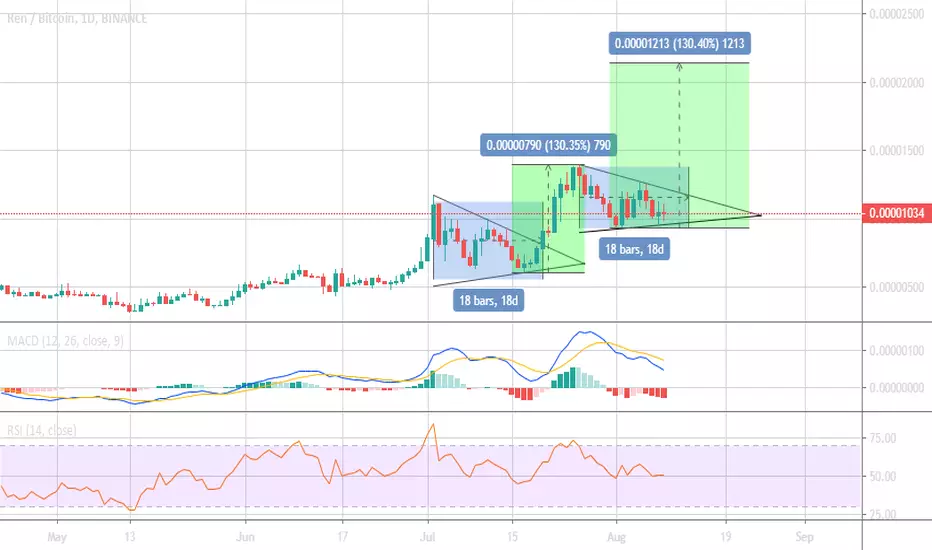
As you can see there are two very similar symmetrical triangles on this chart. Price action and length of the triangles are similar. Price could once again breakout on the 18th day of consolidation 8/13/19. Last time this setup occurred, we saw a 130% increase in price. If this happens again, we could see a price of 2150 sats.
Let's see if history repeats itself. I know we wouldn't be mad if it did.
Set stop losses just in case this breaks down.
*THIS IS NOT FINANCIAL ADVICE. I AM NOT RESPONSIBLE FOR ANY LOSSES OF MONEY*
Let's see if history repeats itself. I know we wouldn't be mad if it did.
Set stop losses just in case this breaks down.
*THIS IS NOT FINANCIAL ADVICE. I AM NOT RESPONSIBLE FOR ANY LOSSES OF MONEY*
トレード稼働中
Price has broken below support, BUT price has rebounded back into the triangle. Trade is still active.
免責事項
これらの情報および投稿は、TradingViewが提供または承認する金融、投資、取引、またはその他の種類の助言もしくは推奨であることを意図したものではなく、またこれらに該当するものでもありません。詳細は利用規約をご覧ください。
免責事項
これらの情報および投稿は、TradingViewが提供または承認する金融、投資、取引、またはその他の種類の助言もしくは推奨であることを意図したものではなく、またこれらに該当するものでもありません。詳細は利用規約をご覧ください。