REN/USD
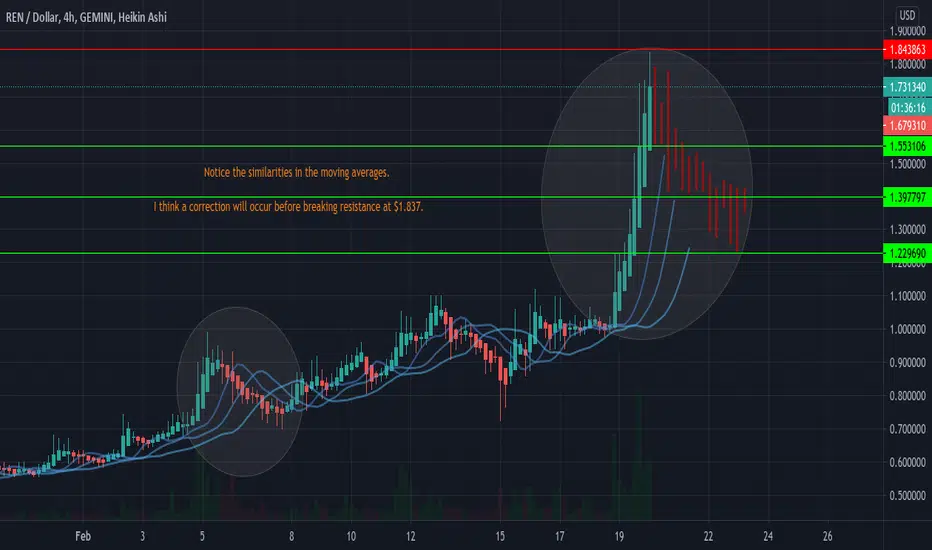
This chart on REN/USD focuses on moving averages and volume. I outline how the moving averages/volume are similar to a previous move that already took place. I attempted to simulate what I believe could be coming in the near future by recreating the pattern I was able to identify. With the recent price movement I expect a healthy retrace and outlined 3 possible levels of support (green) to look out for if REN ends up correcting. Once we go through this correction I expect for us to pass through the line of resistance drawn out (red).
I am posting for feedback on my ideas to learn and improve my TA. I am NOT a financial advisor and I suggest everyone does their own research before investing in anything.
Please like, comment and follow.
Thanks!
I am posting for feedback on my ideas to learn and improve my TA. I am NOT a financial advisor and I suggest everyone does their own research before investing in anything.
Please like, comment and follow.
Thanks!

免責事項
これらの情報および投稿は、TradingViewが提供または承認する金融、投資、取引、またはその他の種類の助言もしくは推奨であることを意図したものではなく、またこれらに該当するものでもありません。詳細は利用規約をご覧ください。
免責事項
これらの情報および投稿は、TradingViewが提供または承認する金融、投資、取引、またはその他の種類の助言もしくは推奨であることを意図したものではなく、またこれらに該当するものでもありません。詳細は利用規約をご覧ください。