ロング
RFN RFN RFN
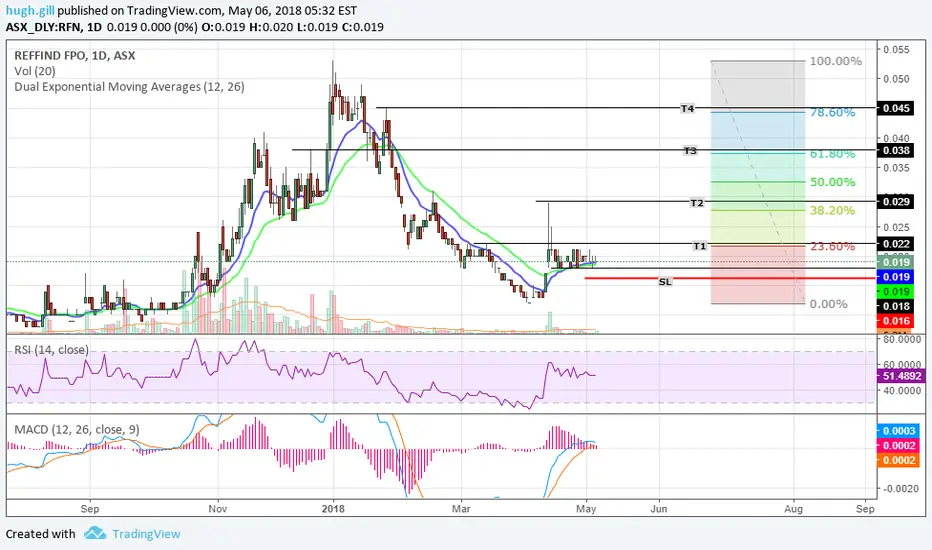
RFN is currently trading above the 26 period EMA which it historically used as a support/resistance.
The 12 and 26 period EMA has crossed with sellers drying up on the pull back. Gives a potential Bull flag on Weekly chart.
Look for Bear MACD cross on daily for an indication of a further pull back.
Tight stoploss @ 16 and long term target marked with T1,2,3,4 etc.. Relative fib levels should be used a guided profit target levels.
Safer to wait for break of 21 cent on good volume to confirm uptrend.
The 12 and 26 period EMA has crossed with sellers drying up on the pull back. Gives a potential Bull flag on Weekly chart.
Look for Bear MACD cross on daily for an indication of a further pull back.
Tight stoploss @ 16 and long term target marked with T1,2,3,4 etc.. Relative fib levels should be used a guided profit target levels.
Safer to wait for break of 21 cent on good volume to confirm uptrend.
トレード稼働中
Potential MACD convergence on Weekly and pulling back on decreasing volume. Setting up a potential Bull Flag??

関連の投稿
免責事項
これらの情報および投稿は、TradingViewが提供または承認する金融、投資、取引、またはその他の種類の助言もしくは推奨であることを意図したものではなく、またこれらに該当するものでもありません。詳細は利用規約をご覧ください。
免責事項
これらの情報および投稿は、TradingViewが提供または承認する金融、投資、取引、またはその他の種類の助言もしくは推奨であることを意図したものではなく、またこれらに該当するものでもありません。詳細は利用規約をご覧ください。