
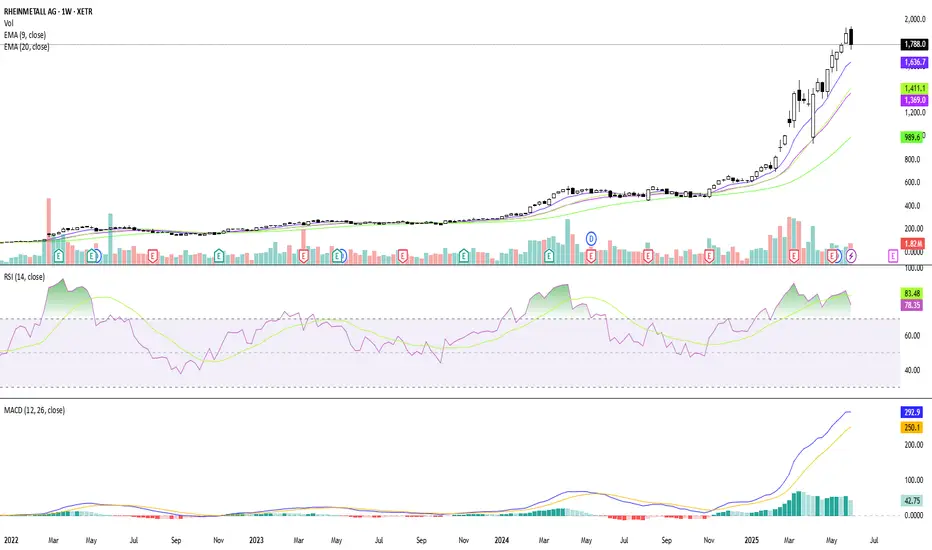
This chart is part of my active trading analysis on Rheinmetall (RHM.DE), focusing on both intraday movements and short-term trends (2–5 days).
Included Indicators:
EMA (9, 20, 50) – to assess momentum and dynamic support/resistance
RSI (14) – for overbought/oversold levels
MACD – to detect potential trend reversals
Volume – for confirmation of breakouts or fading moves
Included Indicators:
EMA (9, 20, 50) – to assess momentum and dynamic support/resistance
RSI (14) – for overbought/oversold levels
MACD – to detect potential trend reversals
Volume – for confirmation of breakouts or fading moves

免責事項
これらの情報および投稿は、TradingViewが提供または承認する金融、投資、取引、またはその他の種類の助言もしくは推奨であることを意図したものではなく、またこれらに該当するものでもありません。詳細は利用規約をご覧ください。
免責事項
これらの情報および投稿は、TradingViewが提供または承認する金融、投資、取引、またはその他の種類の助言もしくは推奨であることを意図したものではなく、またこれらに該当するものでもありません。詳細は利用規約をご覧ください。