
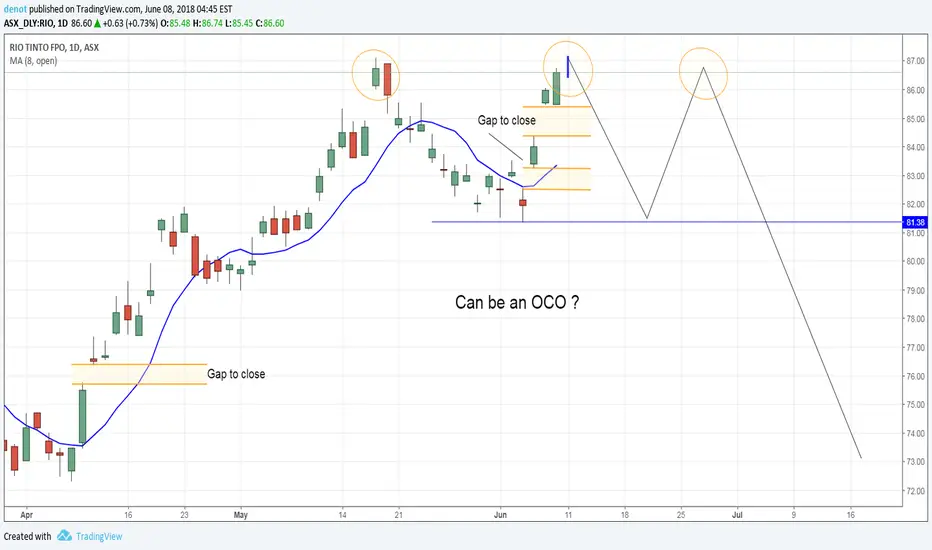
Using my "Imagined Reality", this seems like the formation of an OCO. In addition, the attraction of the 2 GAPs below helps confirm my imagination. If this happens, see:
1- Nothing is 100% in graphical analysis
2 - The fall of the asset will not be linear, there will always be "up and down".
3-As can be seen, I put a small blue line to show that the asset can still go up a little more, maybe 1 or 2 days, to form a head with neck and then fall.
Eye alive ... #luizdenot #xbroker
1- Nothing is 100% in graphical analysis
2 - The fall of the asset will not be linear, there will always be "up and down".
3-As can be seen, I put a small blue line to show that the asset can still go up a little more, maybe 1 or 2 days, to form a head with neck and then fall.
Eye alive ... #luizdenot #xbroker

免責事項
これらの情報および投稿は、TradingViewが提供または承認する金融、投資、取引、またはその他の種類の助言もしくは推奨であることを意図したものではなく、またこれらに該当するものでもありません。詳細は利用規約をご覧ください。
免責事項
これらの情報および投稿は、TradingViewが提供または承認する金融、投資、取引、またはその他の種類の助言もしくは推奨であることを意図したものではなく、またこれらに該当するものでもありません。詳細は利用規約をご覧ください。